


Analysts face many dilemmas. One of them is directly related to Mixpanel vs Amplitude confrontation.
Many consider these analytics tools so similar and even their own websites do not make it easy to decide. So how should product and marketing teams know which one of these platforms to go with?
They both are great. They both offer robust features and integrations. If compare these tools with the more widely used Google Analytics, they are primarily event-based and have a precise focus on user behavior tracking.
After all, no matter what choice you make, both Mixpanel and Amplitude will empower you to level up your marketing analytics and lead to success. However, there are no two marketing teams are the same, and there are indeed benefits you’ll get from choosing the best possible fit for your own workflows and campaigns. So, this choice will still have to be made.
We are here to help you with it. Let’s get more about these powerful analytics systems.
Contents
Introduction to Amplitude
What is Amplitude app?
Amplitude is a reliable web and mobile analytics software with cross-platform user journey tracking, user behavior analysis, and segmentation capabilities. In comparison with Mixpanel, it has a more modern feel. The tool mainly focuses on what happens after a user signs up and what users are doing inside your product.
Amplitude helps businesses in finance, electronics, sporting goods, and other industries with retention tracking, user engagement, and more. It allows going beyond such metrics as page views and clicks. It allows seeing every path users take in a single view and zoom in to understand the context and intent behind their actions.
What are the features Amplitude offers?
Amplitude offers such powerful features as web and mobile apps analysis, A/B testing, channel attribution, funnel analysis, cohort analysis, retention tracking, in-app events tracking, revenue tracking, push notifications, and more.
Amplitude’s usability and the interface can be described as rather positive. The platform has got the standard left-hand navigation pane. Its demo tour will take you through each one of those, explaining what they do.

Introduction to Mixpanel
What is Mixpanel app?
Mixpanel is a platform that basically focuses on the post sign up of the website and the events performed by the users. It can track every single event performed by the users. The tool came into the market in 2009 and gradually became more and more popular.
What are the features Mixpanel offers?
Applying Mixpanel, you can focus on each user specifically. Among the most useful features provided by Mixpanel we can highlight creating funnels, user analytics, analyzing retention cohorts, fleshing out user journeys, goal tracking, referral source tracking, and many other outstanding features associated with analytical tools.
Mixpanel analysis has events that take place on the webpages of your site. For example, adding to a cart or completing a form or downloads So, everything that can be done – can be measured.
The tool divides data into segments triggered by the events into the users who took this action. This segmentation-first approach to data analytics is the key focus of the UI/UX. The A/B testing functionality in Mixpanel allows you to measure the success of two variations of your site content, then implementing the most successful one.
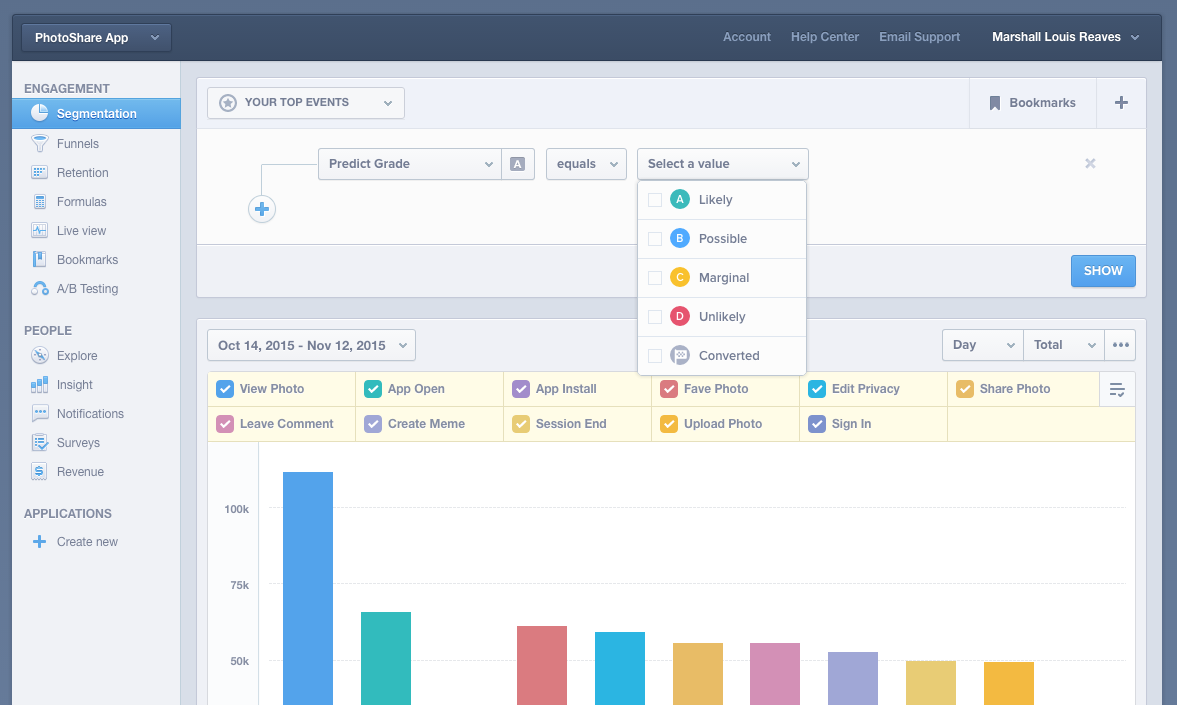
You may specify an event you want to measure, and this tool will analyze the data from user journeys that previously completed that event in order to predict the chances of future users completing the event at the end of the same user journey.
You should not have any specific skills to use Mixpanel, as everything is clear in it. Its navigation panel looks smart, and all the menu titles there are largely self-explanatory.
Mixpanel offers a tutorial video that clearly explains each feature of the navigation pane, as well as what it does, and how it may help you.

Now let’s compare both analytics tools in terms of usability, features, and price.
Amplitude vs Mixpanel: Usability
Amplitude
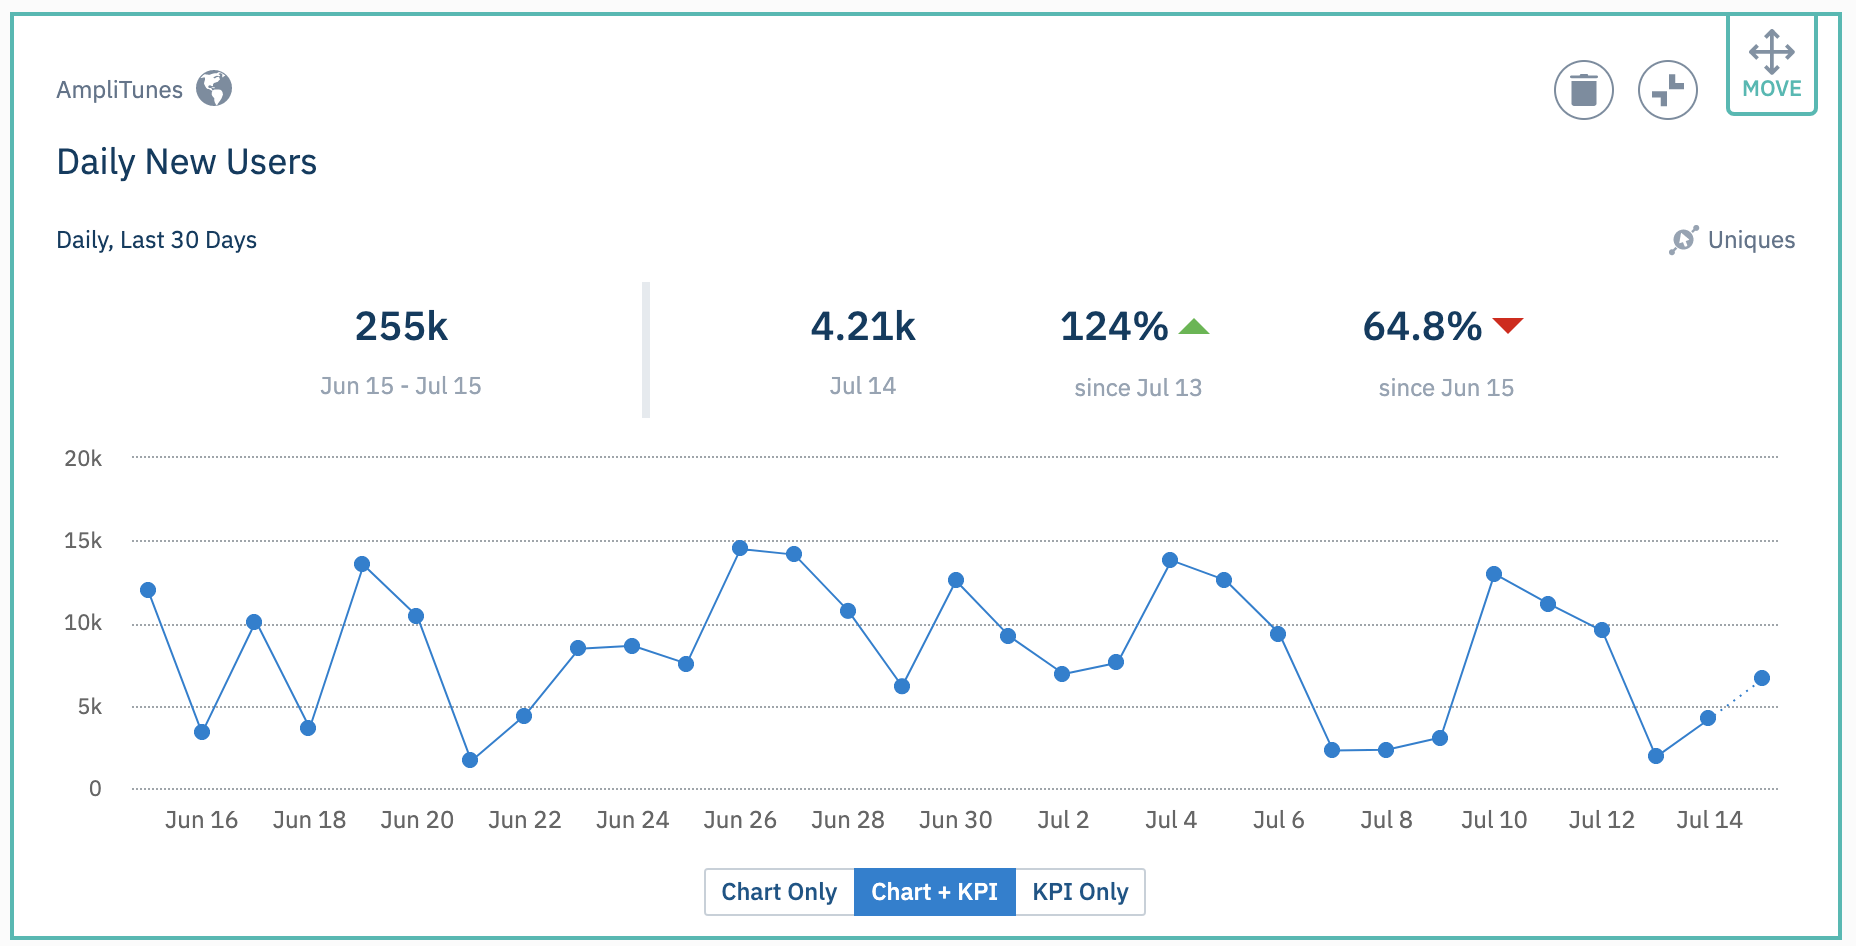
The interface and usability in Amplitude can be described with only one word – “positive”. Its user interface dazzles with the bright colors used in the design.
Amplitude has a standard left-hand navigation panel, and the demo tour will take you through each one, explaining what the tool does. Different charts and graphs make great use of color to help with their clarity. The design seems soft and friendly, more so than other graph-orientated analytics platforms.
Speaking about the initial setup, you’ll need somebody to drop code in the different pages containing events you want to track. There is no plugin for easy access for WordPress users.
In general, Amplitude looks really cool for the product-orientated digital marketer.
Mixpanel
Mixpanel’s usability also looks fine: everything is clear and much where you’d expect it to be. It has a typical left-hand navigation panel where the menu titles are largely self-explanatory.
The tool provides beginners with a tutorial video that explains what Mixpanel can do, and how it will help you to interpret massive amounts of data.
At the same time, Mixpanel’s setting up looks a bit labor-intensive. If you decide to go with the code provided, you would need to be confident in using the code.
Mixpanel’s customer support is available via email during office hours, or live chat. The access to live chat depends on which tier you’re signed up for.
Wrapping it up, Mixpanel is a really usable tool and presented with straightforward and digestible clarity.
Amplitude vs Mixpanel: Features
Amplitude
Amplitude uses an event-focused approach to their data collection that leads to many analytical outcomes. The company is proud of the data visualization it collects, presenting you with bite-size of actionable and digestible information. Lots of these chunks of information can be customized, but it does come with a bunch of standard ones from the outset.
The data it collects is focused on the events. However, the events are derived from your products. The main idea is that if you can interpret what users are doing relative to the products you offer, you will understand what it is about the product you can do to improve it (or remove, if needed).
Amplitude promises priority support when you move to a higher tier. By the way, all of their support is via email. The Enterprise unpriced plan offers more features.
Mixpanel
Mixpanel provides the analysis of the events that took place on your website, including purchases, downloads, or completing a form. The tool segments the data triggered by these events into the users who took this action. It makes the mass amounts of data that can be gathered into more digestible chunks. This segmentation-first approach to data is the key focus of its interface.
It offers the A/B testing feature, allowing you to measure the success of two variations of your website content, then implementing the most successful one. The business tier allows exporting user information that makes it useful for CRM management.
Amplitude vs Mixpanel: Pricing
Amplitude
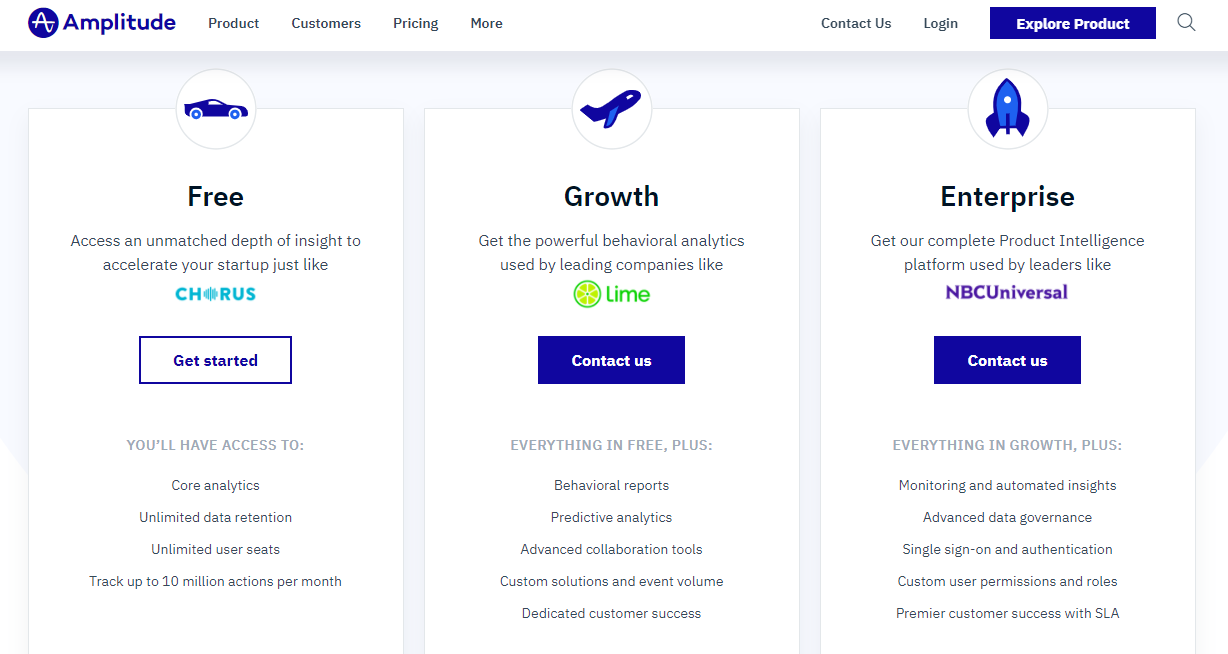
How much does amplitude cost? Amplitude uses a freemium model for its pricing. Its free tier looks similar to Google Analytics with the main difference that it is focused on actions that are taken on the website’s pages, which they call events.
The middle tier in Amplitude will cost you about $2000 per month. Of course, it looks costly compared to some of the other analytical tools. However, you can customize the amount of data you want to process. To do this, you will need to contact them to find out.
The Enterprise tier is so expensive, they do not even put it on their website.
So, is Mixpanel good? Look through the features that are offered by each tier, and you will see a lot of information to consume.
Mixpanel
How much does Mixpanel cost? Mixpanel offers Free, Growth, and Enterprise plans. The higher the tier, the more money you pay, and the more stuff that’s included in your package. Such tiered pricing is great for the company, but users shouldn’t get carried away with what’s offered at higher tiers.
Mixpanel supports a freemium model, meaning their first tier is free to use. However, here the tool provides only 60 days of data. This is not good for mid-to-long term evaluation.
In the second tier, the features are largely based on extensions to what’s available in the free version. For example, you can access 12 months of data as opposed to 60 days.

Summary of the Most Demanded Features of Both Tools
| Features | Amplitude | Mixpanel |
| API | + | + |
| A/B testing | + | + |
| Automatic notifications | – | + |
| Dashboard creation | + | – |
| Event tracking | – | + |
| Conversion tracking | + | + |
| Data visualization | – | + |
| Performance reports | – | + |
| Behavior tracking | – | + |
| Real-time reporting | + | + |
| Search functionality | – | + |
| Cohort analysis | + | + |
| Funnel analysis | + | + |
| Revenue tracking | + | + |
| Uninstall tracking | + | – |
| Third-party integration | – | + |
| Google AdWords integration | – | – |
| Facebook integration | – | + |
| Twitter integration | – | + |
| Mailchimp integration | – | + |
| Sales Cloud integration | – | + |
| Zendesk integration | – | + |
Mixpanel vs Amplitude: Which Tool Wins?
Deciding between Mixpanel and Amplitude apps is complex and depends on your company’s specific requirements.
Let’s say, Mixpanel offers more flexible and cheaper pricing on their Growth plan. Keep this in mind in case your business is fairly price-sensitive. If you strive to make the most out of a free plan, then Amplitude comes out ahead in most categories. It wins on data retention, actions per month, and data export. Mixpanel only wins in predictive analytics.
Hopefully, this roundup comparison was useful in making a decision between Mixpanel and Amplitude.
Conclusion
Today the amount of data that can be gathered is enormous and the businesses that are willing to take advantage of it are making moves to be on top.
So, what is your choice in the “Amplitude vs Mixpanel” confrontation Which analytics tool looks better for your purposes? Be sure, the answer is hidden right in your business.
Depending on your company (literally in its audience, size, life stage, and goals ), the data analytics solution that’s the best fit may be different from what the competitor or company across the street is using. Explore them both and make the right choice!
*pictures used are from pexels.com and unsplashed.com (Gratisography, Cottonbro, G. Becker)