


Eric Sefert of Wooga company was a speaker at the GDC. He told the audience what’s better: to buy several thousands of installs per day or purchase traffic for a hundred thousand dollars once while trying to get to a TOP. He also spoke about how much TOP-1 costs in the USA, are there games which need marketing and how to evaluate virality of a project and calculate traffic price based on it.
Contents
Wooga approach to development
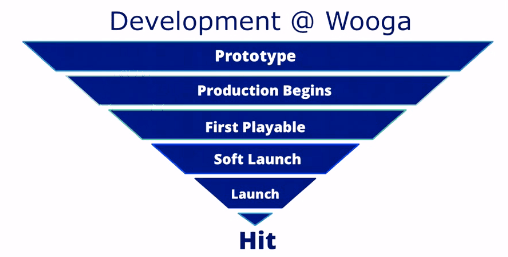
Let’s start with how the development process is built in the company. The structure of the working process reminds a reversed pyramid.
The scheme is quite simple. Everything starts with a prototype. We prototype many ideas in order to choose the best one. Then we get down to production. Further on, a gameable demo version is prepared. After this, “soft-launch” and global launch follow. The last stage, which we call a “Hit”, embodies project success on the world market.
Advance on pyramid stages happens in special meetings where we decide whether the project is ready for a new development stage or it’s time to stop.
Common development strategy looks like this:
- small development teams are gathered.
- the teams make piles of prototypes.
- ready prototypes are examined and the ones which have no potential are closed at once.
- by natural selection, we get 2 hits per year.
We don’t have a goal to finish a project and launch it as fast as possible. There’s only one goal — to understand quickly that a project won’t become a hit and close it.
What’s Jelly Splash
Jelly Splash is a project based on widely known match3 mechanics. “Soft-launch” took place on June, 14th 2013 in Canada. A world launch was on August 21, 2013. We got to the “TOP Free” (iPhone) at once in several countries: the USA, France, Germany, Netherlands, Spain, Brazil, and others.
Mobile marketing
There’s an own marketing philosophy in the company. These are the principles we rely on while discussing product development.
There is a simple thesis: “I don’t have to grow an audience. If I’ve created a great game, the audience will grow on its own.” I don’t agree with it and can explain why.
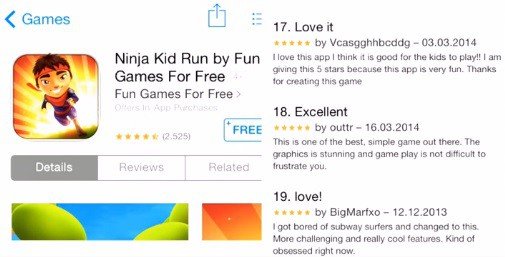
Let me provide an example. There’s a screenshot from an app store above. It displays a promo card for Ninja Kid Run game. The project has 2500 reviews and 4,5 stars rating. People are crazy about the game, they like it a lot. If there are people who leave reviews like “SUPER!!!”, it means that the project is really good. But Ninja Kid is only on the 121 lines of TOP Free rating.
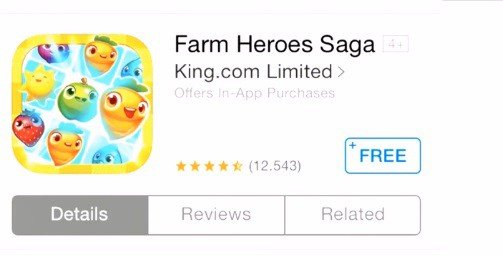
And here’s another game – Farm Heroes Saga. It has the same rating as Ninja Kid – 4,5 stars. But it’s on the 10th line of TOP Free rating. What’s the difference between the games? Gamers like both of them. And if you personally don’t like the genres, you have to recognize the games succeeded. But what’s wrong with one of them? Why one project has got to TOP-10 and the other one couldn’t get even to the 100 best apps? The answer is simple – marketing.
There’s a good idea: “I need to attract an audience as there are hundreds of great games in stores and all of them are fighting for users.” There are no bad games that succeeded by chance. Competition is so strong in the stores that a bad project doesn’t have a single chance. The good and the best are competing. And the winner is the one which has the best marketing.
There are several ideas for the marketing department:
- Scaling. Marketing helps to cover more and more audiences, growing project audiences.
- Optimization. Expenses on attracting new users should be commercially profitable, i.e. you shouldn’t waste large sums of money on abstract goals like “millions of users”. The final goal of any project is income. Marketing helps to maximize it investing a part of it into an effective attraction of new users.
Metrics and marketing efficiency
CPI (cost per install) is the basic unit of evaluation of marketing efficiency.
Here’s the formula of CPI calculation:
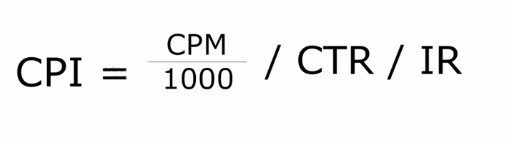
СРМ (Cost Per Millenium) is a number set by the market as usual. You can’t affect it. Though, you may try to search for an advertising partner with the most beneficial conditions for you. But it’s a rather difficult task.
CTR (click-through-rate) is a correlation between clicks and displays or “clickability”. In fact, CTR reflects an interest in your game shown through clicks on banners. You can control this metric yourself, affect it, decrease a click price, raising advertising campaign efficiency.
IR – conversion into installs. It’s not enough to get “effective click”, it’s also necessary that a user installs an app. If a gamer clicks on a banner and encounters low-quality screenshots or unclear descriptions, it will affect the number of installs at once.
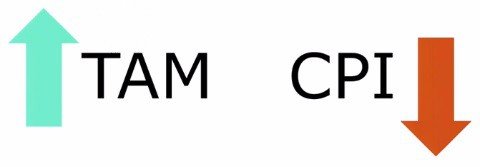
Correlation of TAM (total addressable market) and CPI are displayed in the picture above. They are directed to different sides. As a number of users who are potentially ready to be interested in your game grows, the price for the attraction of 1 user decreases. The more people are ready to click on the banner, the more clicks there are, the more installs. TAM and CPI correlation is displayed in the picture above.
How to increase ТАМ
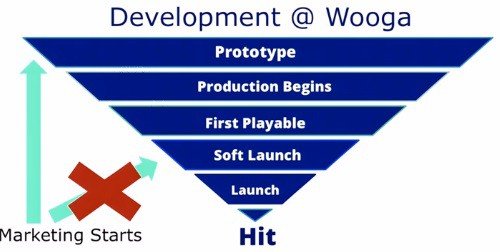
Let’s get back to the development pyramid. Usually, marketing starts from the 4th stage — “soft-launch” because you can buy users there, show them a ready game, and watch their reaction. We think that marketing should start along with a prototype.
At an early stage, marketing should evaluate market, its demand, and develop criteria on which a really good game will be developed. If the audience doesn’t need your game, maybe it’s not good enough? That’s why I totally disagree with saying: “We can make a great game which doesn’t need marketing as an audience will grow on its own.”
Who decides whether the game is good?

It’s a really important question that depends on the target audience. There are 2 people on a picture above. They have totally different understanding of what is a good game. We may say that if a guy likes it, then the project audience is smaller than if a girl will like it.
Let’s get back to the question of the target market extension. How can a marketing company affect a project on the stage of prototyping? A marketing specialist won’t hint you at the right game mechanics but a good marketing specialist will point at how it would be better to present it to gamers, what do they want to see from realization, what do they or market lacks in frames of this mechanics. In other words, it’s a marketing specialist who can take your central mechanics and offer ways of increasing its potential audience.
The analysis includes:
- demographic evaluation of the project as there are settled age groups who pay more.
- revealing main game mechanics which will work for the chosen demographic group.
Development based on data
It has 3 main aspects:
- Analytics. All the means of selecting and analyzing data.
- Experiment. On the basis of the previous point, you see what works incorrectly, where do users have a problem and so you carry out experiments on enhancing your project.
- Work on iterations. Gradual enhancing of some component in order to see user response. As changes are small, so you’ll have to scrupulously examine statistics in order to find it. But that’s the way to protect users from possible negativity of unsuccessful experiments.
Analytics structure in Wooga looks like this:
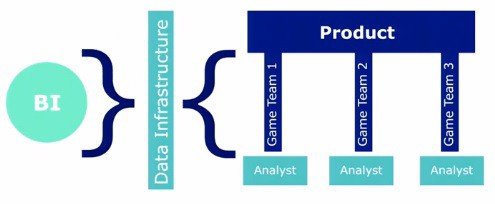
We have a separate independent BI-team that builds and supports data infrastructure — a “layer of data” which all the Wooga games pass through. A needed toolset is created within BI which all the employees use later on.
Further on, there’s an independent product team. There’s an own analyst in each product team who gets access to a data bank, i.e. to all the information on any project. He/she can add to a team of a definite project unique experience of the whole company, constantly studying it, analyzing, and making necessary conclusions. Such a person is needed, nobody should combine his/her functionality. Otherwise, the potential on analyzed data capacity will narrow and the process will become less useful.
“Soft-launch” strategy
The strategy lies between the 2 stages of our pyramid — a “soft-launch” and a release.
So, what’s a “soft-launch”?
- Feedback from users. The most interesting thing is to get feedback from live users. We don’t talk only about word description (in comments or in a FB community) but also about getting data through your analytics. Each user who gets in statistics enhances understanding of problems in a game.
- Feedback from the market. How ready are the users to play your project, how good is the clickability of your banners, what’s the conversion rate from transitions to installs. Besides, you can make the first rough evaluation: how much will project promotion cost you monthly.
- Iterative and cyclic recurrence of development. The earlier the first release takes place, the faster you’ll see how users study your game and stop making abstract hypotheses. Such an approach justified from an economic point of view: while you’re making a big project without any real data and basing on assumptions only, you lose money. It’s better to analyze a small amount of data from a “soft-launch” and spend money on “smart” (calculated) traffic attraction. You make your project better with each iteration and cyclically repeat marketing actions after each stage until you get the necessary results.
- Scalability. You should understand how scalable is your game. When I talk about it, I mean CPI to LTV formula – price for an install to an income from a gamer lifetime in a project. You should clearly understand the conditions when your marketing and project, on the whole, are profitable.
“Soft-launch” duration
“Soft-launch” duration depends on several basic moments:
- How far are your present time metrics from desirable ones? The majority of studios don’t have an exact plan. They just study data and react to user feedback. It’s necessary to understand the difference between realizable goals and insuperable barriers. For example, you have a clear understanding of what Retention is needed for project development in your genre among the audience you’ve chosen. After a “soft-launch” and some experiments, you come to the conclusion that you’re still too far, and maybe you can do nothing to get to the goal fast. And here’s a choice: make a “soft-launch” stage longer or close the project until you waste more effort, time, and money.
- How much you’ll spend on a “soft-launch” stage? Many companies are forced to “reveal to the world” as they need to get some money from users. They can’t enhance a game on a small number of users for a long time.
- Your understanding of competition on the market. Let’s look at the example of the Clash of Clans game clones. If you’ve made a clone of the game in the first half of 2013, you should understand that you don’t have much time for a “soft-launch” as in the second half of the year the market will be full of clones. So you have little time for making the game better and enhancing its indices.
- Completeness of the game. If you launch a game too fast, the period of “soft-launch” will take a little bit more time. It doesn’t mean you should enhance the game to the maximum before a “soft-launch”. Vice versa, if you have an almost completed, perfect game which wasn’t tested “combat conditions”, any revisions and iterative processes will be more difficult. You’ve spent too much time, efforts, and money on this version in order to be flexible about new changes in it.
What’s the goal of the first game release and what should you focus on?
There are 2 main metrics that should be enhanced to the maximum during a “soft-launch” period: Retention and virality.
Retention is the most important metric which you’ll change in your project. Retention is the number of gamers from an initial group who come back to the game daily from. In other words, it’s how many users who have come today will fall out tomorrow, in a week, in a month…
Retention shows the appeal of your game. If a user likes it, he/she will come back to it. If not, you’ve lost a user and it’s very difficult to win him/her back. Besides, retention allows the forecasting lifetime of an average user in a game.
A typical graph of Retention looks like this:
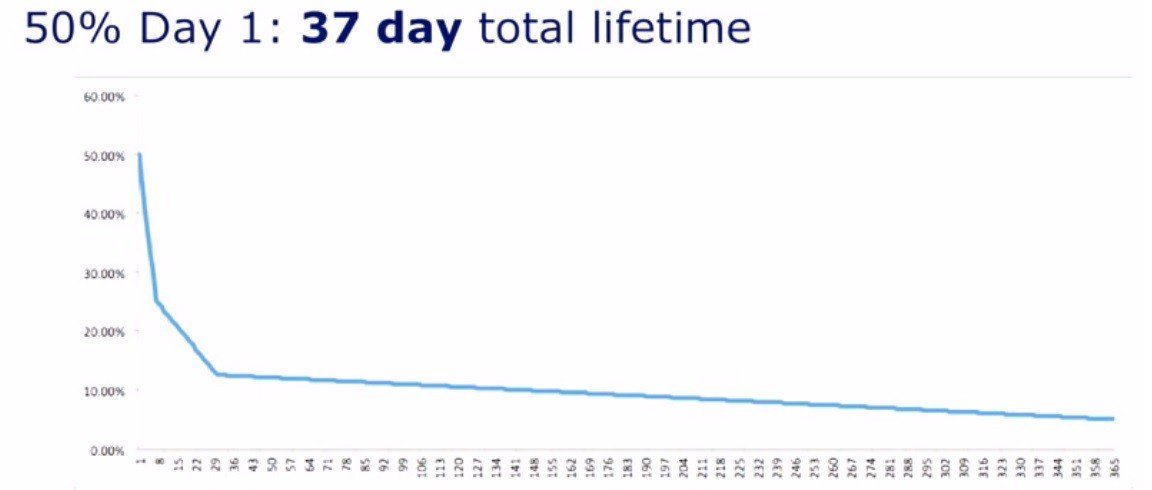
The retention rate from an initial number of users was 50% on the first day. The same dynamics are for the 3rd, 7th, 15th day — the 7th day has shown 50% of comebacks from the 3rd day, etc. If we take the graph as a basis, it means that we have nothing from the traffic on the 37th day. This way, the Retention graph allowed us to learn user LT in 37 days.
Calculating LTV
You have built a Retention graph and on its basis learned a lifetime of a user in a game. The next important step displaying project condition is LTV (Life Time Value). This metric shows how much income do you get from a user during a lifetime.
There are 2 the most popular ways to calculate LTV in our project: Top-Down and Bottoms Up.
LTV calculation graph on Top-Down method looks like this:
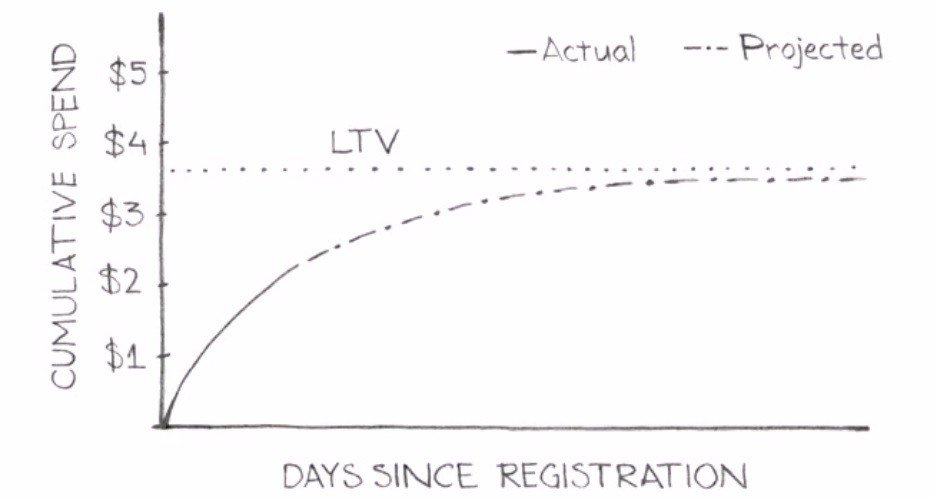
You have cumulative data on user expenses in a game: X (sum of income divided by user quantity) is spent on the first day, Y on the second day, Z on the third day. The value is accumulated on the graph each day. Let’s assume that a monetization graph looks like in the picture above. Now you can take the LT number and build an asymptote on the graph and learn your LTV number. In the picture it’s $3,7. You don’t need to wait for real end of a user lifetime cycle in order to build such a graph. You can forecast some of the data by initial dynamics.
Another way of LTV calculation is Bottoms Up. You use a curve on the basis of your Retention and ARPDAU data.
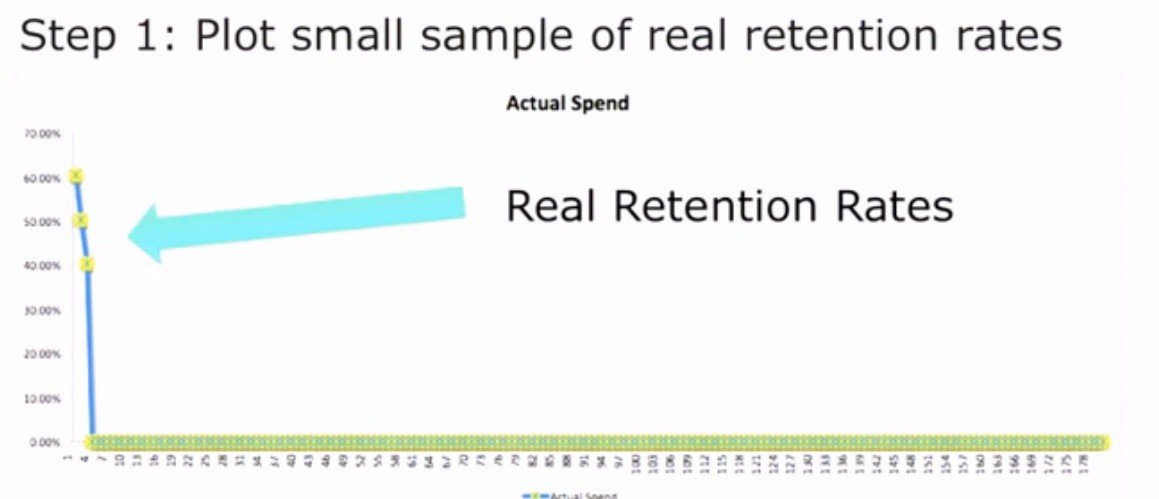
The calculation method is similar to the previous one. You take retention data for the first days. These are Day 1, Day 2, and Day 7 on the graph. The first 3 points will be enough to build the rest of the graph. The curve you get is a power function:
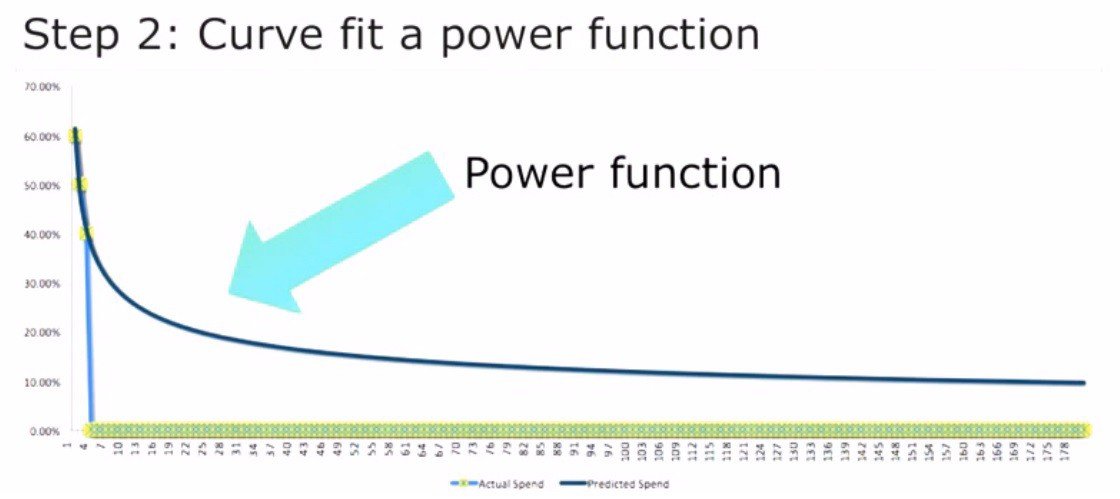
Then you calculate the place under the graph, taking an integral from the function you get. It’s a lifetime. In order to get LTV, multiply it by ARPDAU.

Pay attention that each part of the formula is segmented, i.e. you can take a segment you need, for example, gamers in the USA, iPhone users, select your ARPDAU indices and calculate LTV for a chosen segment.
Virality
Why virality is so important? It’s simple. Users who have come via it are free. And, vice versa, purchasing users is expensive. Surely, developers want as many free users, as possible in order to have more space for marketing maneuvers.
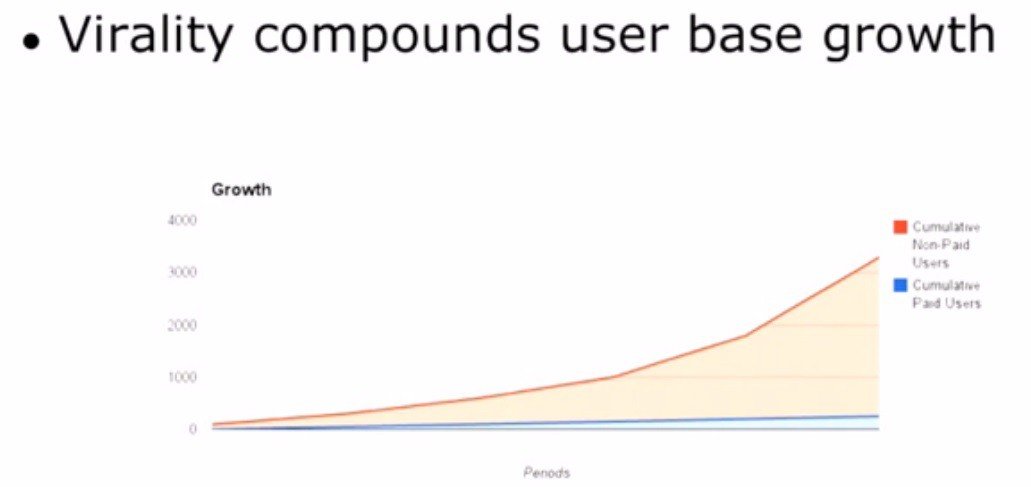
Planned growth of purchased user base is displayed in the graph above. At first, the graph of viral users is similar to the one of the purchased users. But as the project gets to the peak of viral users, there’s a burst. The graphs start to differ totally. I usually compare virality with percent on my savings account. You get more percent on the percent you have already saved. The same with virality. Viral users bring more viral users and your gamer base grows faster and faster.
Virality definition
Unfortunately, it’s difficult to give virality a precise definition. Especially in mobile games, where there’s no single channel for getting users.
Usually, virality is presented (as in maths) by defining it via “K-factor”. “K-factor” is a number of users a user brings to a game.
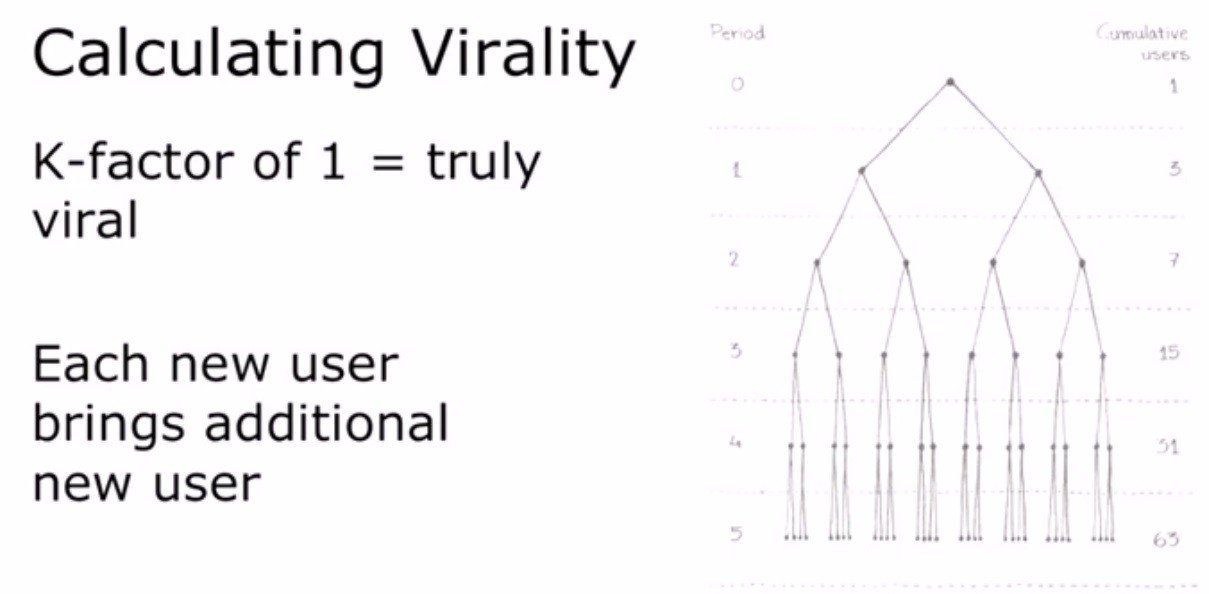
Thus, when a K-factor of your game equals 1, it means that your game is viral. One user brings a new user. And the cycle is endless. If a K-factor is less than 1, it means that the virality of your project decreases with some time.
There are 2 ways to calculate virality:
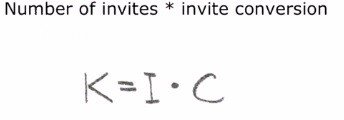
- Top-Down. “K-factor” is calculated by the formula: the number of invitations sent by a user multiplied by the conversion time of these invites into real new users. But the formula doesn’t suit mobile games well as gamers send invitations to a great mass of potential users and it’s difficult to calculate where do they come from. I.e. conversion from invitations is calculated badly. But the formula suited nicely to social games on Facebook. It’s really easy to calculate a “K-factor” here as any invitation comes with a referral link and it’s simple to get conversion data.
- Another method is Bottoms Up. You compare 2 periods and reveal users, for whose attraction you didn’t pay. Imagine that a Day X is a release day. You have definite DNU indexes. You know exactly how many users you paid for. And knowing this, you can calculate how many users have come organically. Now take a look at Day X+1. If there were no changes in the project and you weren’t featured, the number of organic users won’t change, there’s no reason for that. Let’s assume, you paid the same for the users as on Day X. If there’s a delta between the two days – Day X and Day X+1 – that’s a virality.
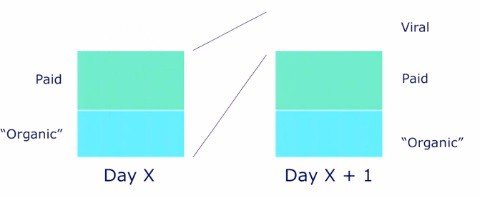
If nothing has changed in the product, virality is simple to calculate. It’s enough to divide the number of viral users on Day X+1 by a number of organic and purchased users on Day X.

If there were significant changes in the project, this formula won’t do. We use the formula during a “soft-launch” period because we don’t key features of the project.
And still why virality is so essential?
Because it helps to decrease expenses on attracting users (СРА). If I buy a user and this user brings another one, so I get 2 new users. CPA cost is divided by 2. It doesn’t make user attraction less significant but it gives the possibility to buy them cheaper or more (it depends on what way is more pleasant for you).
So what are the goals of “soft-launch” you should orient to?
- LTV
- CPI
Only after getting these data, you may decide whether to release a project or no.
“Soft-launch” on the Jelly Splash example
The first release took place in June 2013 in Canada. We got approximately 2 000 new users per day.
The graph of installs in the period of “soft-launch” is presented below:
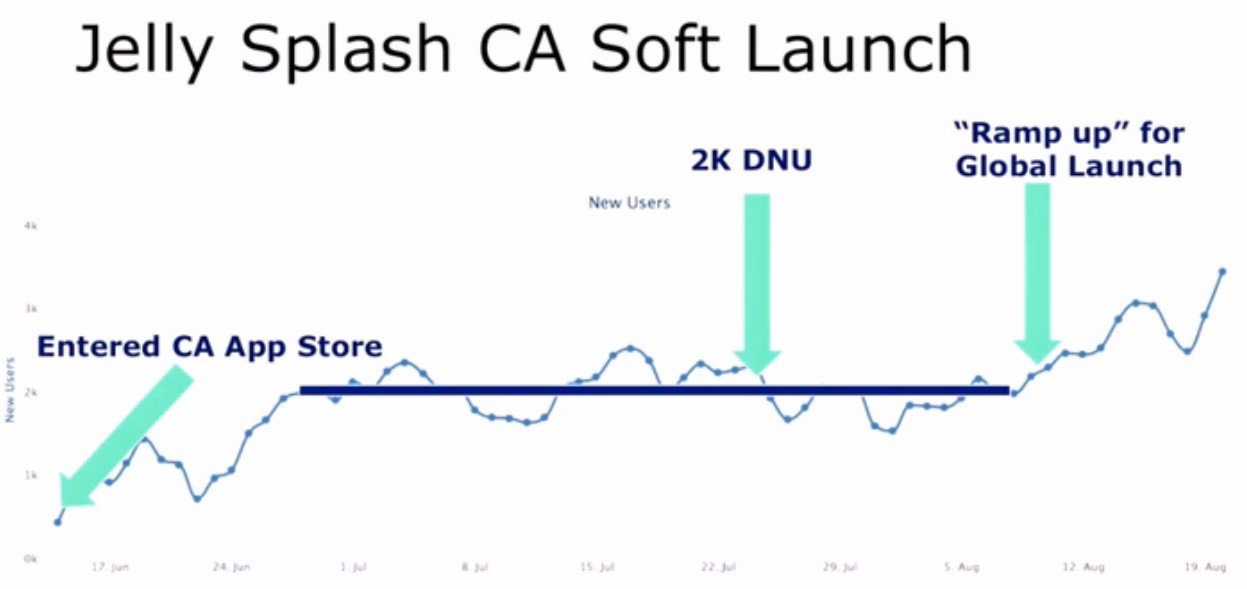
There were almost no installs at first, then we got to a conditional plateau of 2 000 users. A little bit later some project changes made the install graph grow stably. We decided to “open up to the world” at that moment.
What else we noticed during the “soft-launch” period:
- strong virality. We got a 92% “K-factor”. I repeat that we had grown by 2 000 new users in a day, without adding new features or changing the game globally. We could apply virality calculation formula “Bottoms Up”.
- high Retention. Before a global launch, our Retention 1 was 50%.
When we were on a “soft-launch” in Canada, our CPI on the iPhone was $2. But unfortunately, the information was useless for the international release as Canada wasn’t our target market. We targeted the USA but we had no similar games on that market and we couldn’t evaluate how much will user attraction cost.
Apart from the CPI price, we know our “K-factor” — 92%. It decreases the install price twice. That’s why our CPI is $1.04.
We didn’t know how much user attraction will cost in the USA but if LTV was higher than $1.04, we would have a $2 income from CPI.
We talked with other developers and knew that the Canada market was rather expensive. Many teams carry out “soft-launches” here and users know about that. That’s why we assumed that the USA market would fit in our indices of income from the point of view of CPI.
Global launch strategy
As for common knowledge:
- we understood that expenses on marketing would pay off on 1.04 LTV index, keeping $2 CPI.
- we had big TAM — iOS, casual game with high CTR indices. The game was available, not a niche one.
And we had to make a decision about launch strategy — “stairs” or “springboard”.
“Stairs”
The method assumes that any marketing activity brings income. You purchase users by a formula CPI less than LTV. You slowly grow the user database.
Advantages: you almost don’t risk your money. Each day you attract users. In the case of a user, the attraction isn’t profitable anymore, you stop and search for the reason.
Many people forget that the money spent at the beginning of the month will pay off only at the end of the month, the process needs some time. But all the expenses won’t pay off in these 30 days. You won’t pay off the marketing budget in the 6-month time since the launch. Thus, the more money you spend on the project launch, the more money you pay in advance.
Disadvantages: you leave money “on the table” and you can’t predict market changes. Using a “springboard” model, you get money right here and now, but a “stairs” model may bring you income in several months only. And nobody can guarantee that there won’t be a strong competitor at that time.
“Springboard”
It’s a totally different strategy. You launch campaigns where LTV is less than CPI. The campaigns won’t bring you much income. But the goal is to get to a definite place in a TOP. You spend more money in order to get a higher position. Having taken a definite place in a TOP, you get organic installs. And they pay off your expenses.
Advantages: you cover more users. If the virality of your project is good, some “pushes” for getting to a TOP are a good approach. A thesis “time is money” works for you. It’s better to get a dollar now than in half a year.
Disadvantages: huge investigations in advance. You have to spend all the money on release. It’s difficult to calculate the “Price/Risk” correlation as you don’t know exactly what’s ahead. If you carry out a campaign and see that it’s not profitable yet, it’s difficult to forecast when and how profitable it can be in the future. In “stairs” you see the results every day but in a “springboard” model you throw a pile of money into the game release.
The graph below displays 2 types of marketing launches:
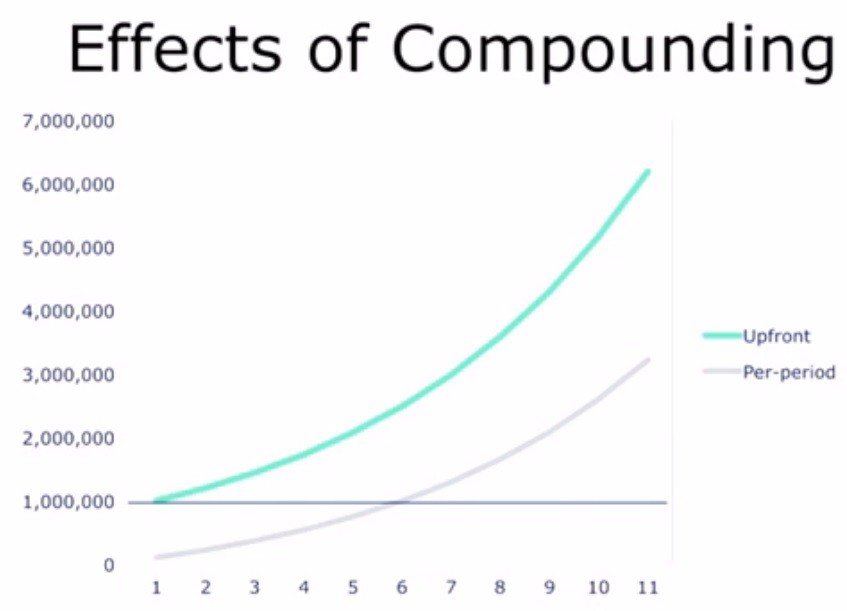
On the upper graph — they bought a million users on the first day (it may be stupid but it’s a vivid example) and they haven’t got a single user.
On the lower graph — they bought a million users as well but the purchase was divided in time, i.e. they were purchasing the same amount of users systematically.
Both projects have the same “K-factor” — 20%. On the one hand, it’s risky and thoughtless to buy a big “push”, but if we compare a dry result, we can see that virality effect has worked for the first project more. And it has a larger userbase. That’s why virality is so important. It affects attracting your audience.
Getting closer to a global launch
Ask yourself one question before a global release — do you completely believe in your project, are you ready to choose a marketing way with a “springboard” or you think you should take a more quiet way? In order to answer it, it’s necessary to calculate the expected expenses.
In the beginning, we need to decide which chart position is a priority for us. We decided that we want to get to TOP-1 for iPhone in the USA. We also had to reach a $2 CPI index.
We also decided that we have to get 20 000 installs per day. This definite decision has no scientific basis. We just talked to other developers and based on our own experience.
Further on we found out, that in order to be in the TOP-1 in the USA we needed to attract 140 000 installs. It would cost $281 000 for $2 CPI.
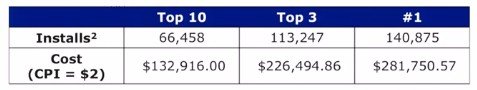
Data on the basis of Distimo analysis
We remembered that our “K-factor” equaled almost 1. One user brought another one. That’s why we discounted the old data and get new ones. Then we had to get 70, ooo installs and spend 140 000 dollars.
But there was something strange in such an evaluation. We got the data that we needed 30 000 users in order to get to TOP-10 apps, 56 ooo users to get to TOP-3 and 70 000 to get to the 1st position. No model based on freemium looks like this. There’s no linear dependence, it just doesn’t exist. We thought that linear progression should look like this as that’s the way it happens in freemium models:

- It’s a growing exponential function.
- The price growth tempo is increasing.
- The price of transition from position №10 in a TOP chart to position №3 and then to №1 differ a lot.
We defined a standard set of target countries (France, the USA, Germany, Brazil, Netherlands) and decided that we should become №1 on all of the markets.
There’s a table below with expected expenses for getting to TOP-1 in every of the chosen countries (with “K-factor”):
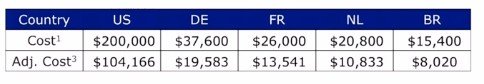
We succeeded in becoming №1 on all the markets with 92% “K-factor”; $2 CPI on the USA market.
We got $150 ooo on the first week after the release. The common budget for the release was $250 ooo.
Logistics of an international release
- Stage launch. We had our own work scheme, we didn’t make a simultaneous release on all the markets. We had only 5 people in a marketing team and a global market release is great stress. We wanted to keep our team safe from it so we made a staged release. That’s why we launched one country a day, except France, it was launched along with the USA.
- A world release took place in 23 networks. We took a “springboard” way. We knew exactly how many users we needed in order to come to zero and bought more. The purchases weren’t beneficial but we supposed that it would pay off when we get to TOP-1 in AppStore.
What we’ve got:
- We exceeded the budget for each network by 25%.
- We actively used social media (Wooga has more than 22 million subscribers on Facebook).
- We used cross-promo mechanics with other Wooga games.
Results of the campaign:
- We got to the TOP-1 in all the target countries.
- 5 million installs in 5 days.
- We became №1 in other key countries, for example in the Scandinavian region.
When we stopped investing money in product promotion, there wasn’t an income decrease. Jelly Splash had a really high Retention.
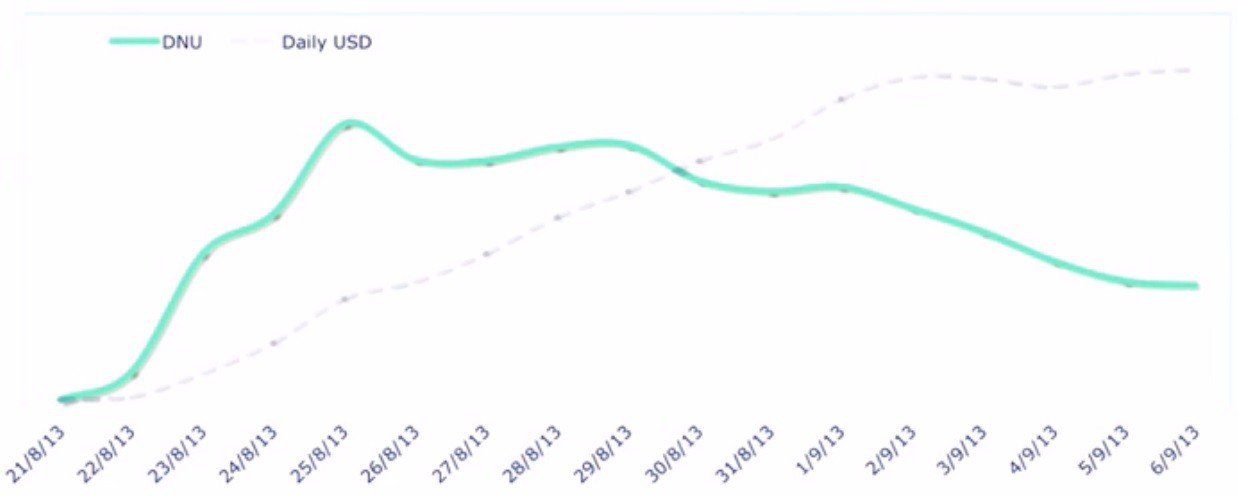
Here you can see a DNU and “Income” graph. We stopped investing lots of money, DNU stopped to grow but the income was still increasing.
What did we learn?
- “Bursting campaigns” may bring income. Yes, we used a “springboard” model but made a deep marketing investigation beforehand and assumed that this model would do. Even we spent a lot in advance on marketing, we got income in the end.
- We got to the TOP-10 in the USA. It gave us an organic DNU growth of 35 000. We got another 50 000 installs in TOP-3.
- The majority of networks promised overvalued traffic capacities. An error was more than 20%.
- There was a fading of virality. The first users who installed the app were and will be the most active ones.
- “K-factor” decreased to 84% in the first month and an effective CPI index increased to 28%.
- We kept CPI on the same level due to work with a great many networks. In the end, we worked with 30 networks and kept CPI on the same level.
4 main conclusions:
- A long period of the first launch gave us a possibility to develop the game iteratively and add changes that became important to the larger audience. We could evaluate “K-factor” and further on knew our game and users so well that we weren’t afraid to launch an international release with a budget of $250 000.
- LTV evaluation didn’t calm us down but it gave us a possibility to come to common release with full-fledged analytics.
- Market analysis. We could evaluate our goals and tasks precisely and reveal where we could be №1 taking into account our expected expenses.
- Virality is essential. We wouldn’t be able to be №1 without 92% “K-factor”. At least with such a budget.