


It’s difficult to decide what characteristics have determinative meaning in the world of mobile apps and what goals should you set for the apps. Here are the results of our investigation.
Contents
Daily active users and monthly active users (DAU/MAU)
20-30% DAU/MAU for games from the whole number of users is really good. For social apps like messengers 50% DAU/MAU may be considered a success.
On the whole, the majority of apps are fighting for keeping DAU/MAU at the level of 20% and more. For a casual game staying at the level of 20% is a really good goal.
According to analyst Fred Wilson, DAU level should be 10% of all the installs, MAU level — 30%. I.e. you should stay at the level of 33%.
Keeping users
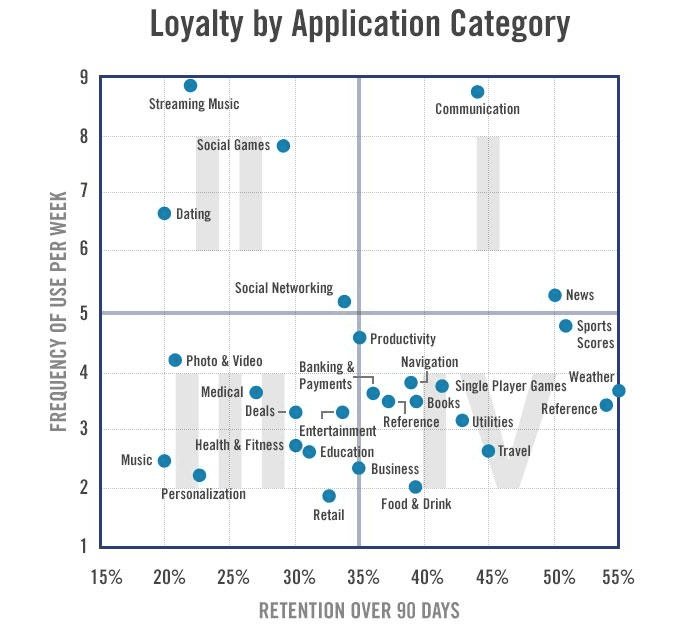
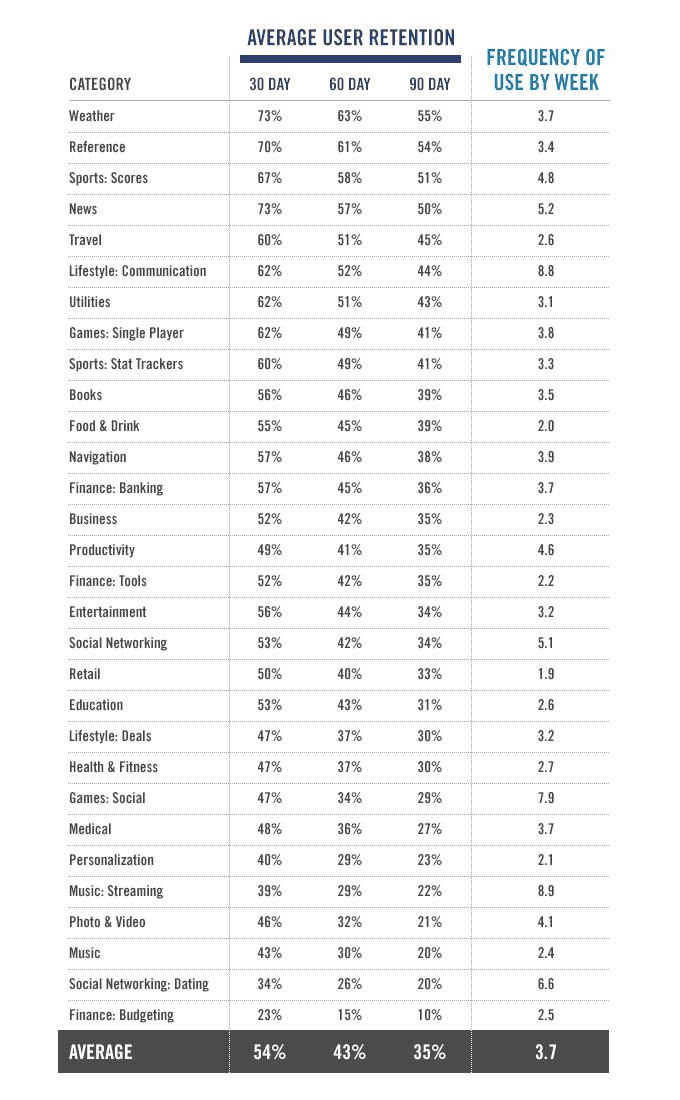
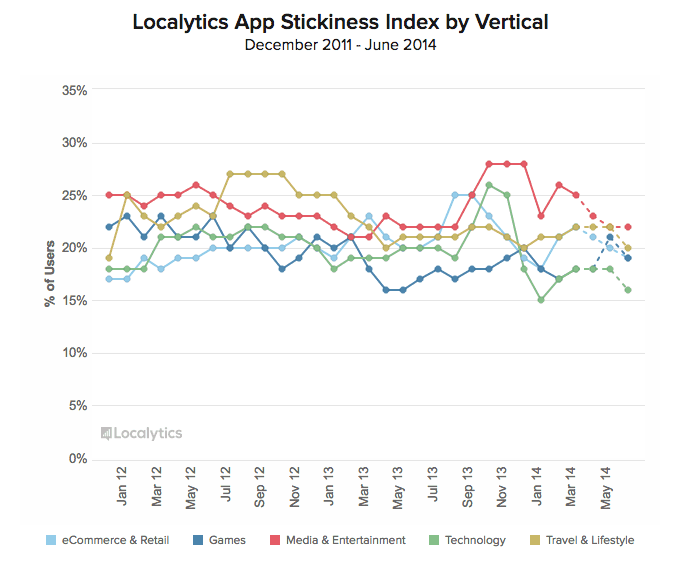
Take a look at a diagram of user loyalty according to app categories. In the IV sector, there are apps that are seldom used, but when they’re used, they bring a good income. Despite this, they can stay in the list of installed apps of a consumer almost endlessly.
For example, imagine how useful is an app for booking flights, hotels, or renting a car for business travels. However, these apps aren’t used between business trips. Their value increases significantly as the time comes to plan the next business trip.
Knowing of which sector an app belongs to, helps a developer to define which business model is better to use. On average, sectors I and IV (all the right side) suits better for business models of apps based on subscription and advertised apps.
The main reason is that these apps represent a permanent value for a consumer for long periods of time and, as a consequence, successfully save client bases. Besides, sectors II и IV (upper left corner and lower right corner) suit for in-app-purchases the best.
As users come back to these apps, again and again, there is a possibility for apps from the IV sector to find new ways of increasing their value, for example, the introduction of additional functionality or paid content.
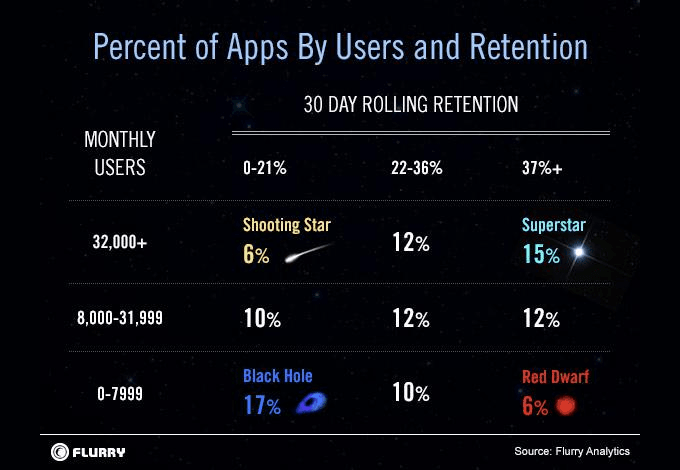
In order to get to a third of the best apps by keeping clients, an app needs at least 37% of all users who started using a service, for example, in November, they would use it again in 30 days.

For the last month, only 14% of users on average of our app remained with the service more than a day after installation.
Keeping users for 7 days has decreased from 23% to 10% in May and keeping users for 30 days has sharply decreased from 14% to 2,3%.
Use of patterns
Period of recession is a time when the growth of monthly users of the app (MAU) decreases by 50% against the quantity of monthly users in the peak period of service existence.
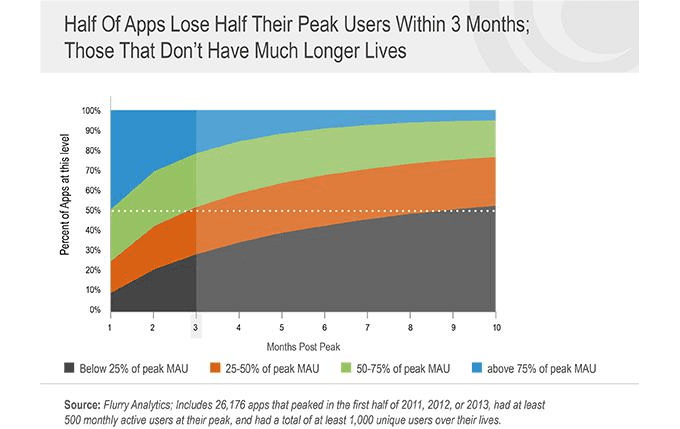
More than half of the apps which could keep more than half of their users after reaching its peak during the first 4 months are still keeping more than half of their users during 10 months after its peak period.
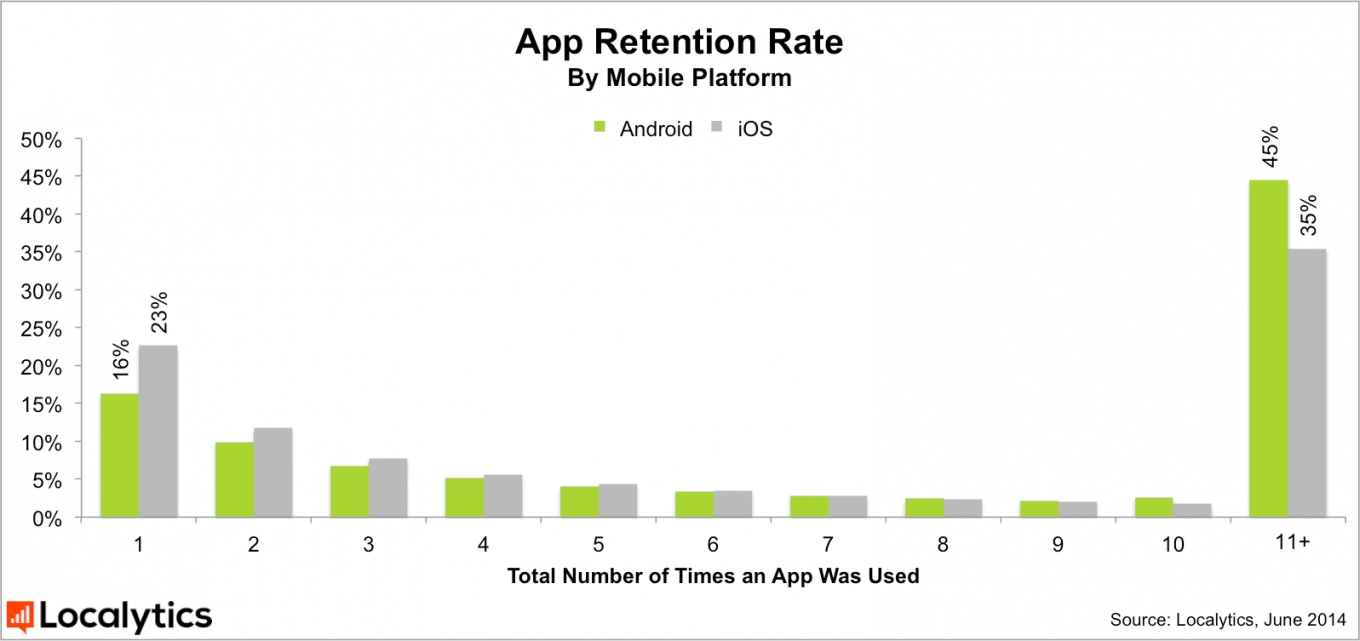
According to Localytics data, 20% of apps will be launched only once after an install.
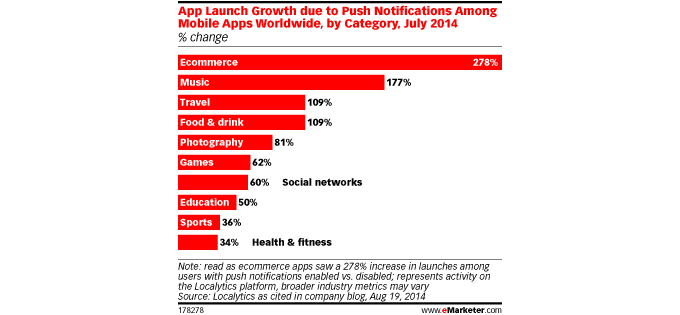
Push-notifications
52% of users agree to get push-notifications. Localytics points out 7%-level of openings for segmented push-notification in comparison with 3%-level of app installs for generated newsletters.
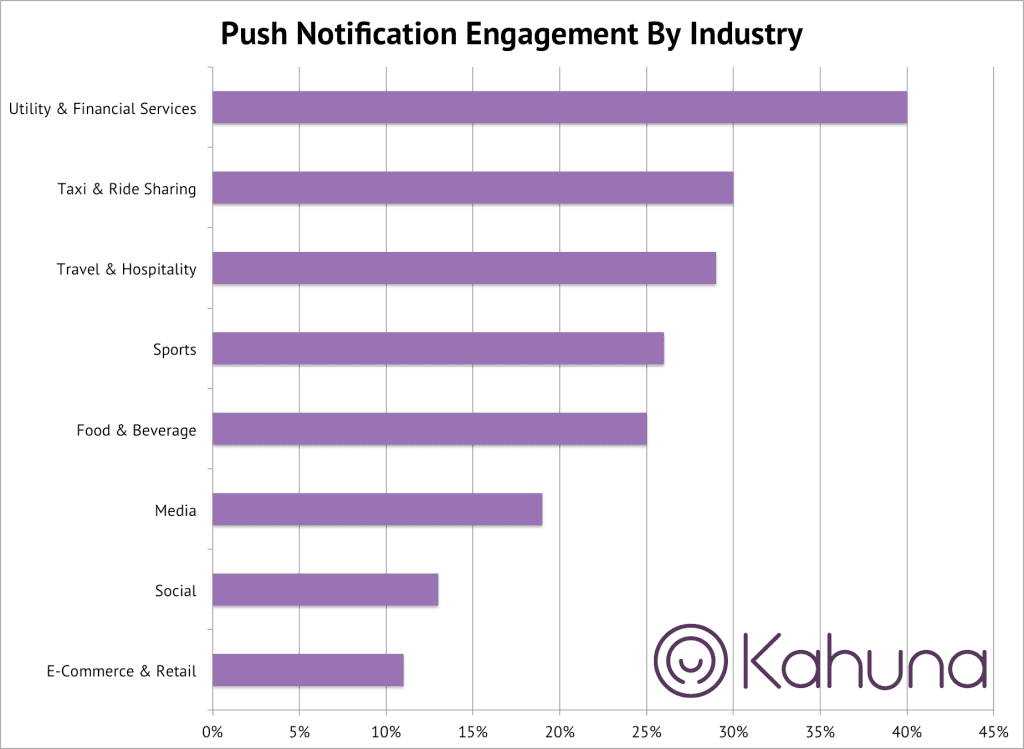
Push-notifications lead to app installs in more than 88% of cases.
Channels of user attraction
What’s the burst of install level when your app has got to Editor’s Choice category in App Store
You can expect an increase of 30 times from the normal level of installs.
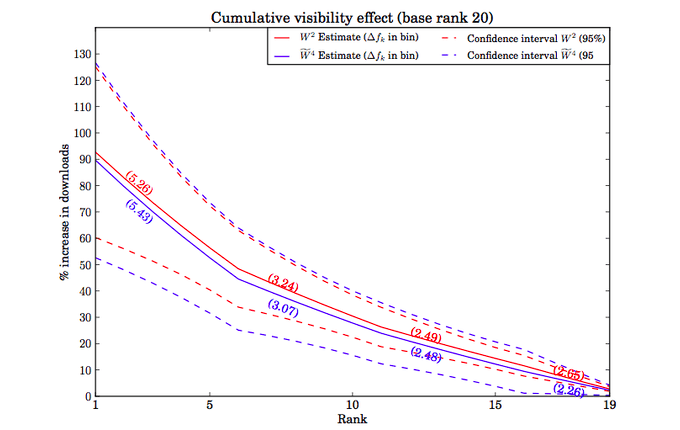
How does the App Store rating affect the install level
If an app, for example, is on the 10th rating line, the demand will be 30% more for it than if the app hasn’t entered TOP-20.
If an app is on the first rating line, the increased visibility increases the sale level by 90%.
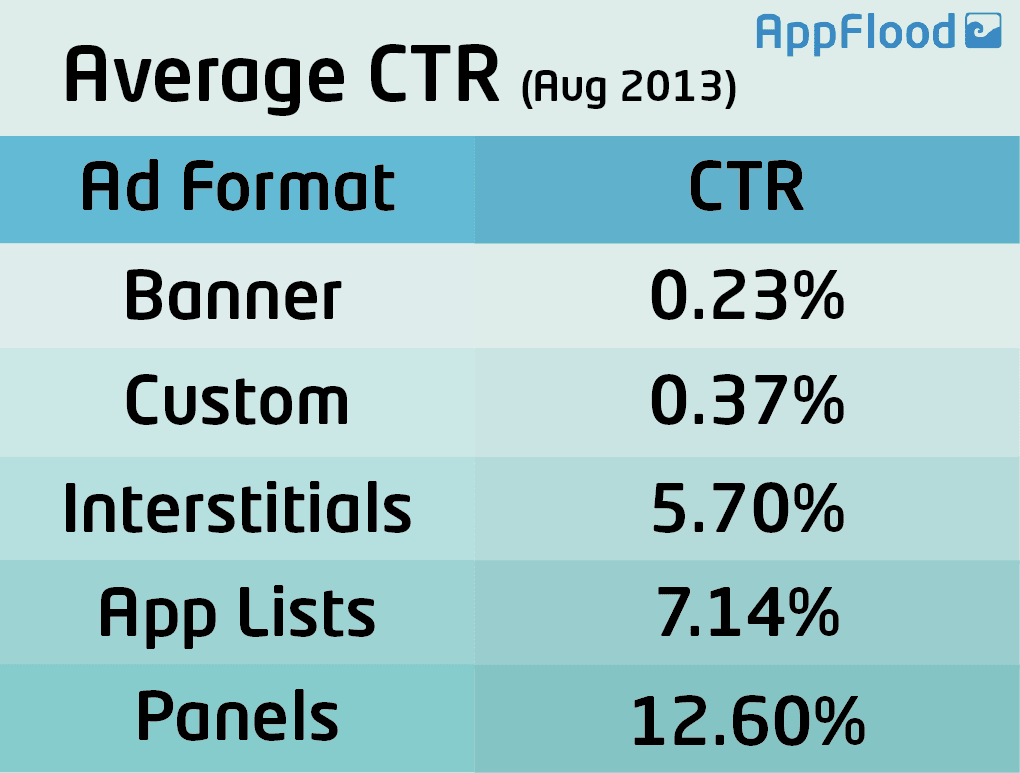
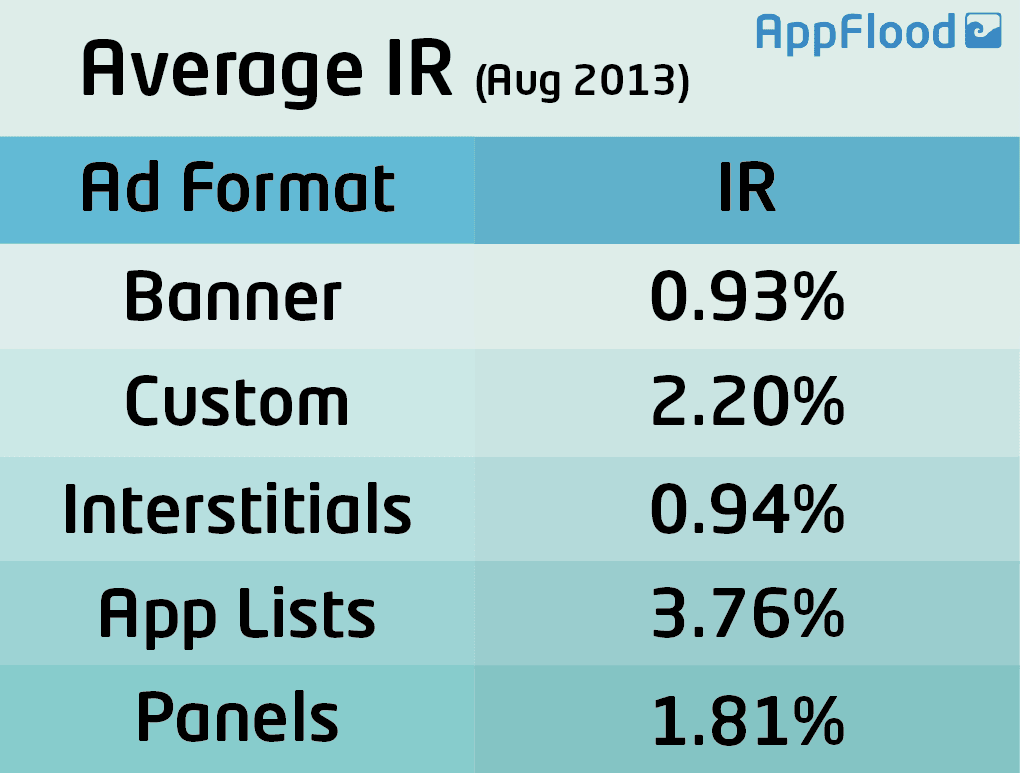
How does placing an app in the popular app category affects install level
I consume that the conversion level makes up about 1-2% for each 3-5% of transfer by a banner. Though, a motivating app install may make CTR of 7-8% or hesitate among 1-2%.
We’re in TOP-200 apps of USA and see that 75% of our users allow seeing exact location.
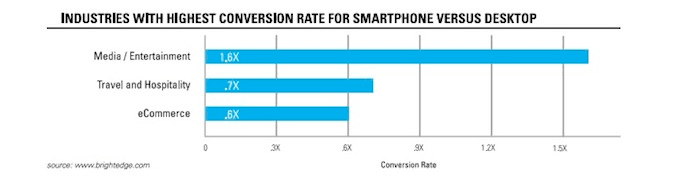
What’s the average conversion rate for in-app-purchases inside free iOS apps
For example, conventionally-free games may convert from 2 to 10 or even more percent of built-in purchases depending on several factors.
How good are the users who came from Facebook
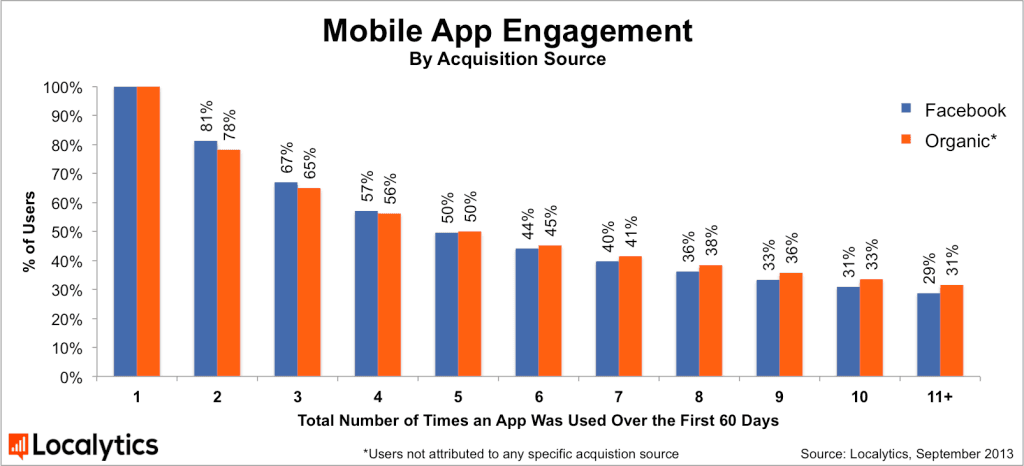
Our data show that advertisements for mobile app installation in Facebook are far more efficient than short time increase in a number of users due to app store ratings. And on the whole Facebook users stay in the service as well as those users who were gained naturally.
During a 60-day investigation, 81% of new users gained through Facebook have come to the app more than 1 time — compare this to 78% index among the users gained naturally.
Revision of demands
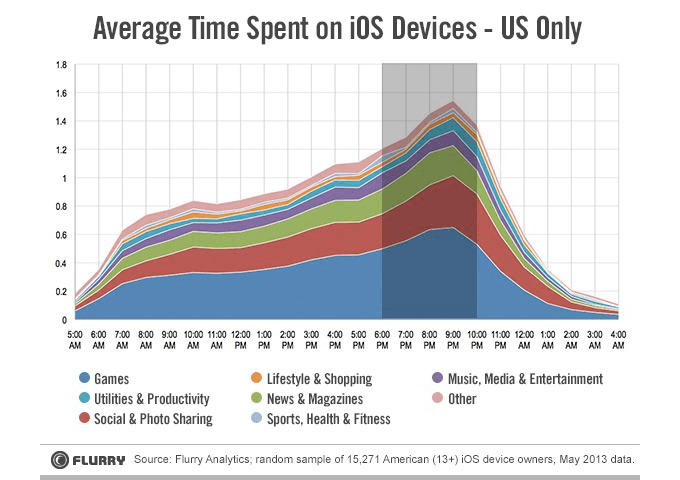
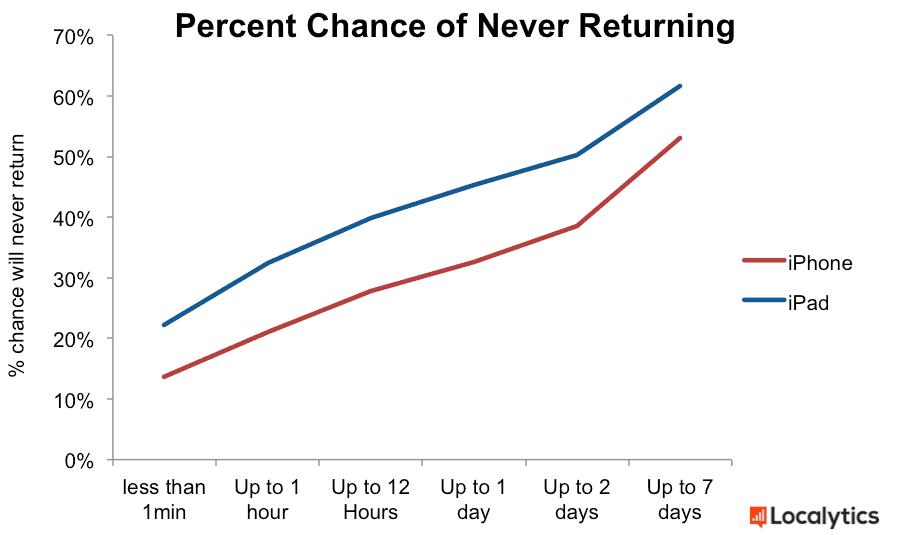
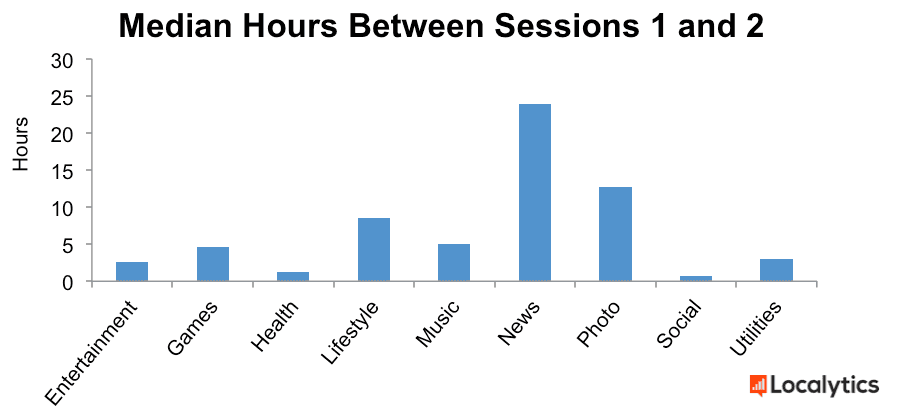
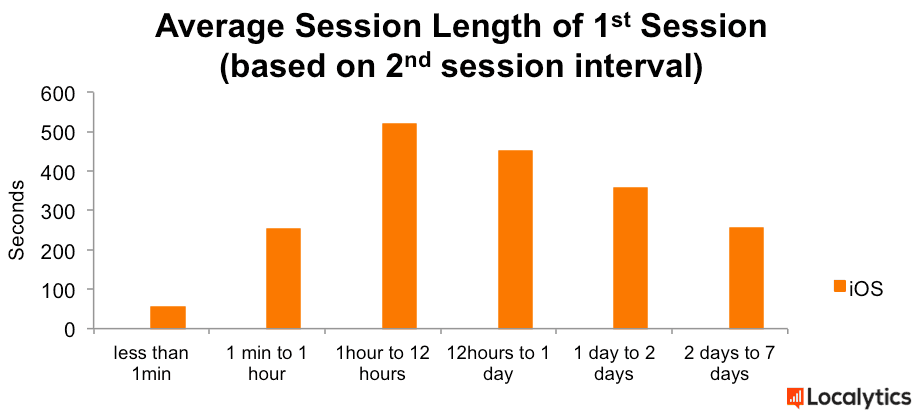
We’ve learned after a global investigation of app use for iOS platforms (on iPhone and iPad) that an average user comes back to an app less than 6 hours after its first use.
However, if a user doesn’t launch an app twice 24 hours after the first use, it’s a 40% possibility that the first session will be the last one.
Key users: percent of app users who open more than 10 sessions a month (highly active users).
Loyal users: percent of app users who come back during 3 months from the first session — a peculiar criterion by which loyalty is measured and demands are revised.
The level of sticking to the app: arithmetic mean between the number of key and loyal users.
Burnout of the app:
 This is a situation, when there are more key users than loyal ones. Users will launch the app, use it for a short period of time, and will abandon it after reaching maximum of involvement.
The maximum quantity of simultaneous service users in real-time will be 10% of daily users’ quantity.
Income for a monthly active user (MAU)
I would say it’s from $0,25 to $0,75 of potential income for one MAU.
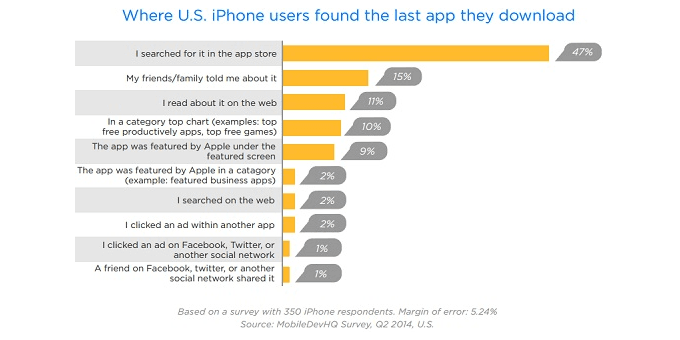
Where do they find apps
Which characteristics should you head for
The data is true for apps in categories “Travelling, lifestyle”. and are based on our own understanding of how app Mygola was created.
Goals
Factual sticking = (DAU – today’s new users) / (MAU – today’s new users) > 20%.
30-day “rolling” keeping (percent of users who have come back to the app on the 30th day or later) > 35% (keeping users of 1st, 7th and 30th day are calculated as percent of the users who were active in any time of 1,7 or 30 days after app install).
Correlation watched/bought > 0,5% for one session.
Correlation of booking tries and actual booking > 10%.
Frequency of use in a week – approximately 3-4times.
App install per month > 10.
Virality coefficient > 0,1.
Percent of users who have opened the app only once < 20%.
Clickability index of push-notifications = 50%.
Permission for defining location > 60%.
To get to the TOP-10 of tourist apps in app stores of each country where we introduce our product.
Time spent in the app > minutes.
Think thoroughly about who you will call an active user. We count session quantity, not the number of days.
Approximately 1-3% of transfers from mobile advertisements leading to an app store should end by an app install.