


We’ve decided to write this article for two reasons:
- The first one is undeservedly little attention of business leaders and project managers to such a powerful management tool as earned value project management.
- The second reason is that the lack of knowledge on this issue doesn’t allow the members of the project team to fully use this method on the level of performance in order to provide managers with quality information on the status of the project.
All this leads to the fact that the earned value project management (EVPM) is often perceived as complex, requiring special training and unnecessary in improving the efficiency of the project management tool.
Meanwhile, EVPM shows the status of the project in terms of answering the question “where are we in the project?”, i.e. meet the basic need of the senior managers – to understand the situation with the project at a glance, and in monetary terms (!). Further, EVPM is able to display it not only in static but also in dynamic, i.e. to demonstrate how the team came to this state and to predict what will happen later.
Yes, the introduction of EVPM requires some managerial, technical and methodological maturity of the company and the project team, but it’s worth it.
The purpose of this article is to provide the staff engaged in projects (especially managers) more or less detailed instructions for use of earned value project management in their work, the formation of understanding of EVPM and simple skills of interpretation of the reports compiled using this method.
Contents
Formation of project status
A bit of theory
There are many theoretical and rather boring works about earned value project management, which in most cases make the reader even more convinced of the complexity of the method and finally grow cold to the idea of introducing it into their work.
Here we will try to avoid this theoretical boredom, yet we can’t exclude the theory completely.
So, what is earned value project management?
As you know, money is the universal measure of everything in the world (except of love, of course). In money you can estimate the cost of this or that thing, company and even reputation. In money you can also estimate the status of the project, and this is especially true when the project involves significant capital investment.
To begin with let us imagine a situation where our project, such as digging a well, consists of a single work. Let this work, for simplicity, last 100 days, worth $100 million (this is a special, very expensive well =)) and been expressed in cubic meters (the number of units, which express the work, we will call “physical volume”). And during the work, it’s necessary to dig 3530 ft3.
So, we have a project:
| Work | Duration, days | Volume, ft3 | Cost,$ |
| Digging the well | 100 | 3530 | 100,000 |
It is quite obvious that according to the plan we have to dig a well with the intensity of 35,3 ft3 per day while spending $1,000 per cubic meter.
If after 10 days of work everything will be going according to the plan, the project team will have to dig 353 ft3 and spend $10,000.
Imagine, however, a situation when the project manager submits a report to the head of the company after 10 days of work, and the report says that the actual cost of the project at the moment amounts to $12,000 instead of the planned $10,000. The question asked by the head, in this case, is obvious: Why does this overpayment take place? Because the money is spent inefficiently (i.e. more than planned), or because the project is ahead of schedule?
In the case of a single work, as in our example, it’s not difficult to find it out – just look at the amount of work performed physically. If we have planned 353 ft3, then there is an overpayment of funds, and if we have 424 ft3, then it is obvious that the project is ahead of schedule at the time of conducting the report. And what is worse, if the amount of the executed work is less than planned 353 ft3 (318 for example), it means not the only overpayment but also being behind schedule. Conversely, if the amount of the executed work is more than 424 ft3, it means not only being ahead of schedule but also cost-saving.
Let’s represent these options in tabular form:
| Schedule delays and cost overruns | Being behind the schedule | All according to plan | Overpayment | Being ahead of schedule | Being ahead of schedule and cost savings | |
| The actual amount of the executed work | 318 ft3 | 318 ft3 | 353 ft3 | 353 ft3 | 424 ft3 | 459 ft3 |
| The actual cost of the work | $12,000 | $9,000 | $10,000 | $12,000 | $12,000 | $12,000 |
But what if the project includes a thousand of works, expressed in different units (ft3, pcs., %), which have different duration and cost, and many of them can be performed simultaneously at any moment of time? Some works at some point may be ahead of schedule and some, on the contrary, be behind. In this case, it’s impossible to refer to a single physical volume and compare the actual costs ($12,000) with the planned ($10,000).
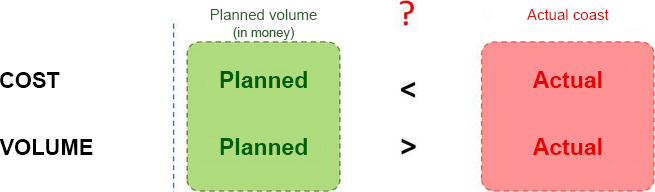
See, however, these figures more closely:
What is $ 10,000 in this example? It’s the cost of a physical volume of 353 ft3, which the project team had to perform in 10 days after the start of the project, spending money for the project in accordance with the plan costs. I.e. $10,000 is a planned cost of the planned works to the current moment.
What is $12,000? It’s the amount of money spent by the project team on the performance of some actual work. I.e. $12,000 is the actual cost of work actually performed.
No wonder that it is impossible to compare them directly.
At this point, the concept of earned value project management can be useful. Earned Value is a kind of “intermediate agent” allowing to compare these two quantities “through itself”.
What is the earned value?
Earned Value is a planned cost of work actually performed.
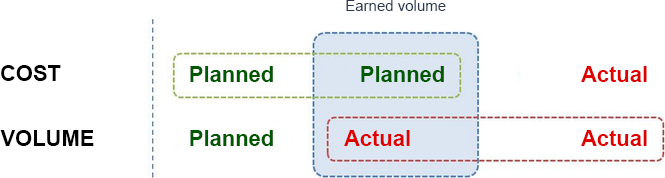
In other words, earned value is the actual amount of the executed work in the planned pricing.
It is not difficult to compare the earned value to the planned and the actual ones:
If the earned value (EV) exceeds the planned (expressed in the same pricing), it means that at the time of conducting the report, the project team has performed more work than planned, i.e. the project is ahead of schedule. If the EV is less than the planned cost of work, it is obvious that the project is behind schedule.
Similarly with the actual cost:
If EV exceeds the actual amount of money spent, i.e. planned cost of the executed work is more than the actual cost of the same work, then cost-saving takes place, as doing the same work, the project team, in fact, spent less money than originally planned. And vice versa – if EV is less than the actual cost, the project team overpaid, because the cost of the same work is more than planned.
Let’s see how it will look like in our example (as it is known, the planned rate of 1 unit of volume is equal to $1,000).
Let’s calculate the earned value for the tenth day of the project execution for the previously presented scenarios:
| Planned volume | Earned value | Actual costs | |||
| Schedule delays and cost overruns | > | $9000 | < | $12000 | |
| Being behind the schedule | $10000 | > | $9000 | $9000 | |
| All according to plan | $10000 | $10000 | |||
| Overpayment | $10000 | < | $12000 | ||
| Being ahead of schedule | $12000 | $12000 | |||
| Being ahead of schedule and cost savings | $13000 | $12000 |
As you can see, the calculation of the earned value allows to unambiguously interpret project status, comparing all the three values.
Obviously, when using the earned value, the presence of any quantity of works measured in different units in the project is no longer a problem. Since all the three values are measured in money, they can be calculated for the whole project, summing the corresponding values calculated for each of the works.
The earned value allows us to understand how effective (in terms of timing and cost) the project team develops the planned capital investment in the project and if this efficiency is poor, then promptly decide on the corrective actions in a project.
The convenience of the earned value also lies in the fact that this indicator allows measuring not only the state of the whole project but the state of any of its parts. On the other hand, this indicator can be calculated for more general categories – a total portfolio of a company.
So, having calculated the earned value, we now know “where we are” in the project. But, as we’ll see later, this is only the tip of the iceberg of the earned value.
We must ask ourselves the following questions: How much we are ahead / behind or save/overpay? How have we come to this state? How can the project develop in the future, if we continue to execute it within the existing trends? And how should we work in order to complete the project on time and within budget? On this later.
Indicators calculated on the basis of the earned value
The earned value itself allows establishing the fact of being of the project in a certain state. A more detailed analysis of this state allows indicators derived from it.
The simplest indicators calculated on the basis of the earned value include:
- An indicator of deviation from the schedule
- An indicator of cost variances
- An indicator of meeting deadlines
- An indicator of implementation of cost
The first two indicators are absolute, the second two are relative.
An indicator of deviation from schedule expresses the deviation in money and is calculated as follows:
An indicator of deviation from schedule = Earned value – Planned value.
In fact, this figure is a specific amount by which the project team is ahead or behind in the development of the planned budget.
Obviously, an indicator of deviation from the schedule will be negative if the team is behind the planned terms of the project. This indicator will show the cost of work executed by the project team at the time of conducting the report.
Similarly, an indicator of cost variances shows the deviation from the planned budget:
An indicator of cost variances = Earned value – Actual cost.
If an indicator of cost variances is negative, then its value will show the amount of overpayment at the moment.
An indicator of meeting deadlines and implementation of cost allows moving from absolute to relative indicators. This transition is useful for comparison of the status of various projects, the building of indicator diagrams (traffic lights, etc.) and prediction of the project outcome, as it actually reflects the cumulative trends in the implementation of the project.
An indicator of meeting deadlines compares the earned value to the planned one. The formula for its calculation:
An indicator of meeting deadlines = Earned value / Planned value. If an indicator of meeting deadlines is less than one, it indicates the delay in execution of work.
An indicator of implementation of cost shows the effectiveness of the financial costs of the project at the moment. Obviously, if an indicator of implementation of cost is less then 1, it indicates the cost overruns on the project.
An indicator of implementation of cost = Earned value / Actual cost.
Let’s look at these figures on the example of our hypothetical project:
| Earned value | An indicator of deviation from the schedule | An indicator of cost variances | An indicator of meeting deadlines | An indicator of implementation of cost | |
| Schedule delays and cost overruns | $9000 | -$1000 | -$3000 | 0.9 | 0.75 |
| Being behind the schedule | $9000 | -$1000 | 0 | 0.9 | 1 |
| All according to plan | $10000 | 0 | 0 | 1 | 1 |
| Overpayment | $10000 | 0 | -$2000 | 1 | 0.8 |
| Being ahead of schedule | $12000 | $2000 | 0 | 1.2 | 1 |
| Being ahead of schedule and cost savings | $13000 | $3000 | $1000 | 1.3 | 1.08 |
Each row of the table, in fact, is a “mini-report” on the state of the project for different scenarios.
So, let’s make a small subtotal:
To assess the situation with the project at a particular time we need three factors: the cost of work scheduled to perform at this time, earned value and the funds actually spent at this point.
To specify the description of the situation, show specific values of being ahead / behind, overruns/savings we need two derivative indexes, calculated on the basis of the first three – an indicator of deviation from the schedule and an indicator of cost variances.
Finally, to show the status of the project on the indicative level and get the opportunity to conduct a comparative analysis with other projects or alternative scenarios we need to use these three indicators to calculate two relative indicators – an indicator of meeting deadlines and an indicator of implementation of cost.
As you can see, there is nothing complicated here, and all the three indicators allow us to say much about the state of the project.
However, despite its visibility, it is still static indicators reflecting the situation at one point in the timeline of the project. Let’s see how it looks in the dynamics and see how we have come to this situation, and most importantly, what can happen with the project further.
Graphic sense of the earned value
If the planned volume (i.e. the planned cost of work) is represented by periods (e.g. monthly) as a histogram, then a well-designed project will be reflected close to the “hump” in the figure below, and the same planned volume, but cumulative, will be depicted in the graph in the shape of the curve. This curve is also called S-curve.
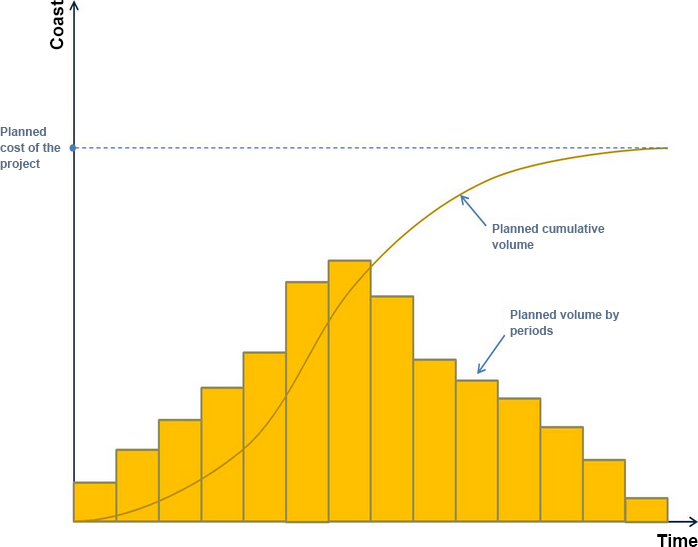
S-curve shows how we should develop the project budget in accordance with the original plan.
In fact, if at the beginning of the project it is dominated by cheap preparatory and other “initial” works and S-curve has a small growth rate, in the middle of a project the largest and most expensive scope of work is carried out, resulting in the fact that S-curve has the greatest growth rate. As the project progresses and the main volumes are gradually completed, the growth rate of S-curve falls.
As a result, S-curve comes to a total planned maximum, reflecting the planned total cost of the project. In terms of earned value, such value is also called the “budget for completion”.
That’s how the project should be developed according to the plan. However, as it is known in real life there are always some variations. Consider them.
Let’s suppose that a project is behind schedule, and the actual cost of work is the planned one. Then by choosing any reporting date on the graph and constructing a curve of the earned value and actual costs (also cumulative), we’ll see the following picture:
As can be seen from the graph, the curves of planned and earned values and actual costs clearly reflect the status of the project at the reporting date in terms of underdevelopment of the budget and overruns of funds. What do we see? Sometimes the planned cost of executed works is “not up” to the desired level, while the actual costs of the project are already significantly higher than the planned.
Note that the already familiar indicators of deviation from schedule and cost variances are also visible on this chart:
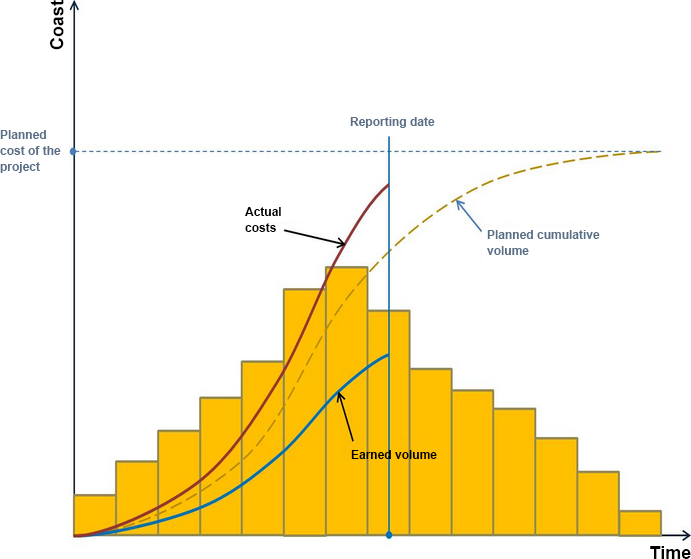
Moreover, the reflection of the time delay of the project is added to the monetary indicators of deviations: Δt shows how much the project is behind the plan in time.
This index can be interpreted also as follows:
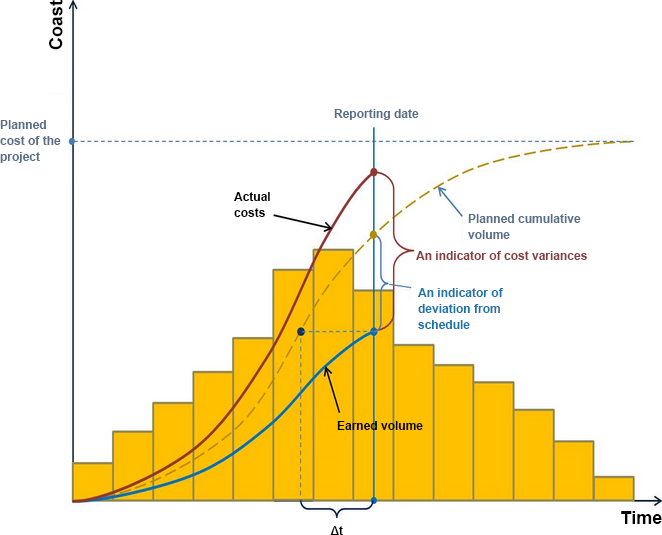
At the reporting date, the project team has executed the amount of work that it must have executed Δt time ago.
This very a graphical representation of the total planned development shows, as it was promised above, not only the state of the project at some particular point in time, but also shows how has “the project come to this point”.
One look at such a chart is enough to understand how well the project “feels itself”. In conjunction with the data from the last table above, the company’s management or the customer of a project can see a short but very descriptive report reflecting the state of the project.